UML Timing Diagram, Design Elements
UML Timing Diagram in the UML 2.0 is a specific type of Interaction Diagrams that describes the timing constraints.
UML Timing Diagrams describes the behaviors of the objects during a certain period of time.
UML Timing Diagram is an inverted form of a Sequence Diagram – the axes are reversed thus the time is passing on the x-axis from left to right, and the different components of the system which interact with each other are arranged on the y-axis.
The Rapid UML Solution for ConceptDraw DIAGRAM contains 13 vector stencils libraries with 393 interactive shapes that you can use to design your UML diagrams.
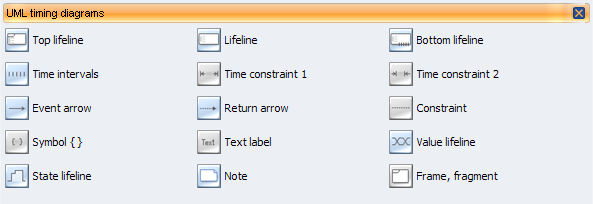
To design a Timing Diagram use the UML Timing Diagram library.
UML Timing Diagram library contains 15 shapes:
- Top lifeline
- Lifeline
- Time intervals
- Time constraint 1
- Time constraint 2
- Event arrow
- Return arrow
- Constraint
- Note
- Symbol { }
- Bottom lifeline
- Text label
- Value lifeline
- State lifeline
- Frame, fragment
Pic.1. UML Composite Structure Diagram Library

Pic.2. UML Timing Diagram Library Elements
ConceptDraw Rapid UML solution provides UML Timing Diagram library of vector stencils for drawing the timing diagrams using timing blocks and assembly connectors.
Use design element from the UML Timing Diagram library to draw your own UML timing diagrams of complex systems and software applications.
TEN RELATED HOW TO's:
UML Class Diagram can be created using ConceptDraw DIAGRAM diagramming software contains rich examples and template. ConceptDraw is perfect for software designers and software developers who need to draw UML Class Diagrams.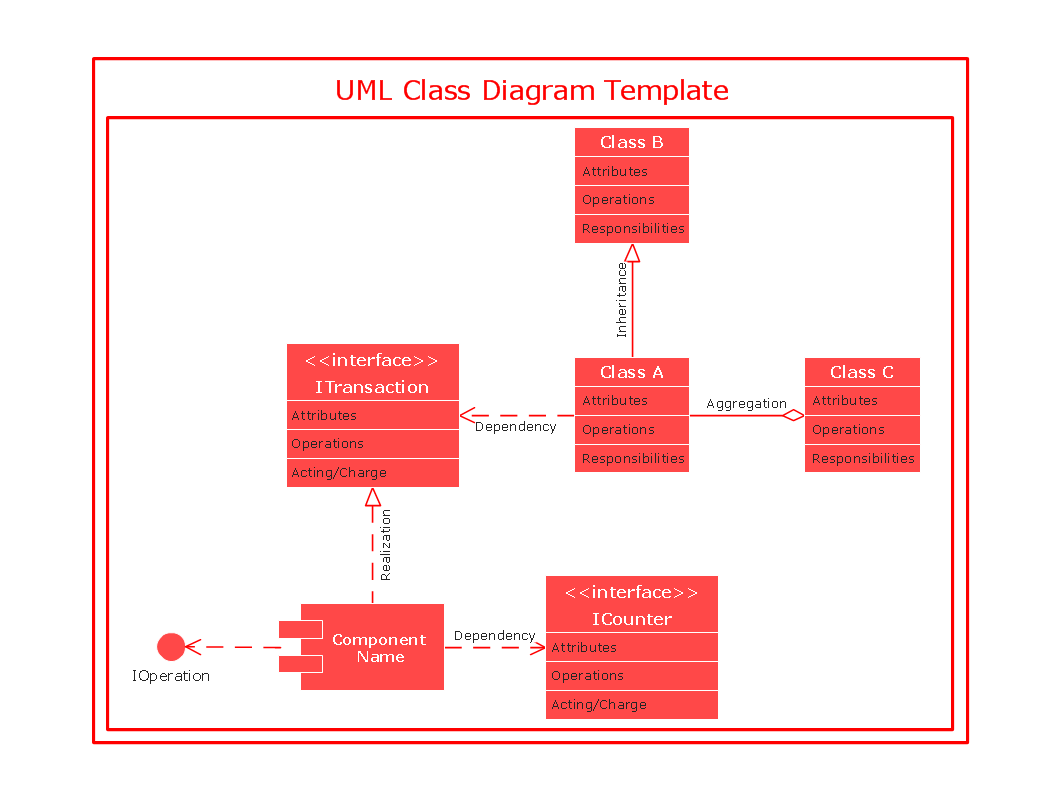
Picture: UML Class Diagram
UML Component Diagram illustrates show components are wired together to larger components and software systems that shows the structure of arbitrarily complex systems.
Rapid UML Solution for ConceptDraw DIAGRAM contains 13 vector stencils libraries with 393 interactive shapes that you can use to design your UML diagrams.
To design a Component Diagram use the UML Component Diagram library.
UML Component Diagram library contains 36 shapes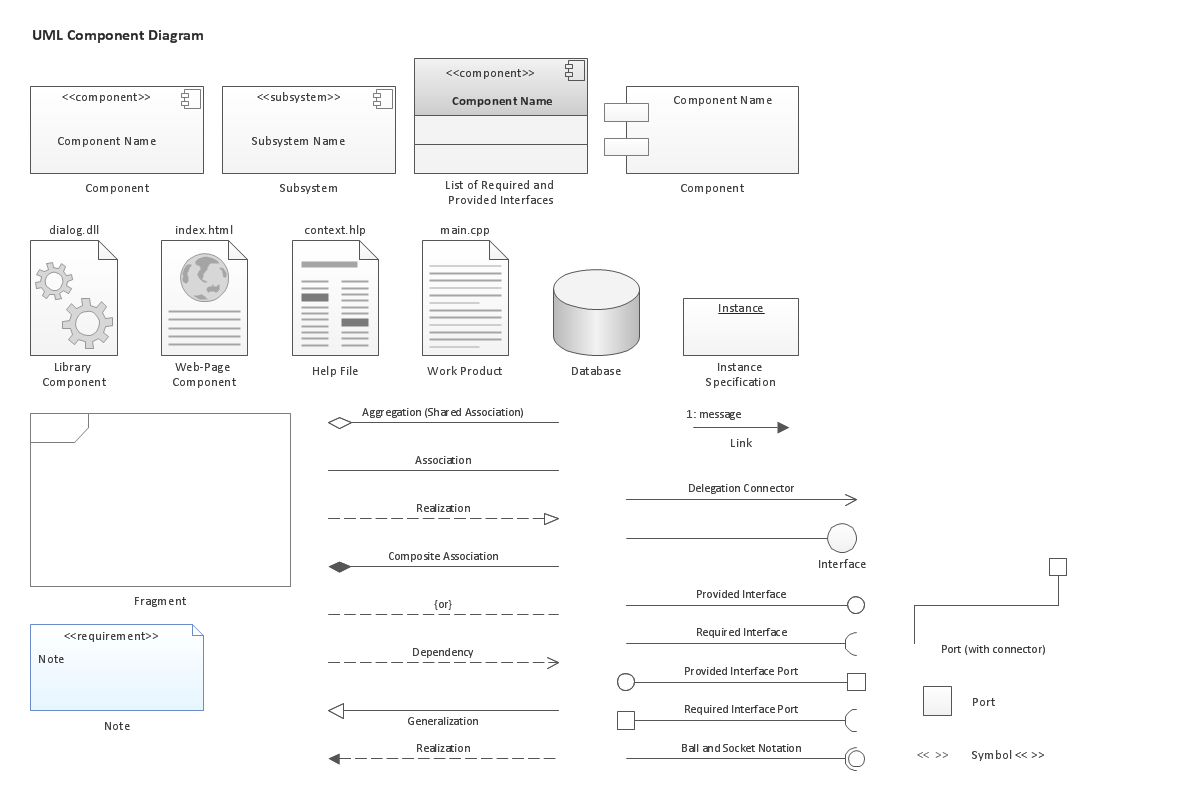
Picture: UML Component Diagram. Design Elements
Related Solution:
ConceptDraw DIAGRAM is a powerful tool for business and technical diagramming.
Software Development area of ConceptDraw Solution Park provides 5 solutions:
Data Flow Diagrams, Entity-Relationship Diagram (ERD), Graphic User Interface, IDEFO Diagrams, Rapid UML.
Picture: Software Diagram Examples and Templates
Related Solution:
UML Sequence Diagram shows object interactions arranged in time sequence, how processes operate with one another and in what order and illustrate the sequence of messages exchanged between the objects and classes involved in the scenario.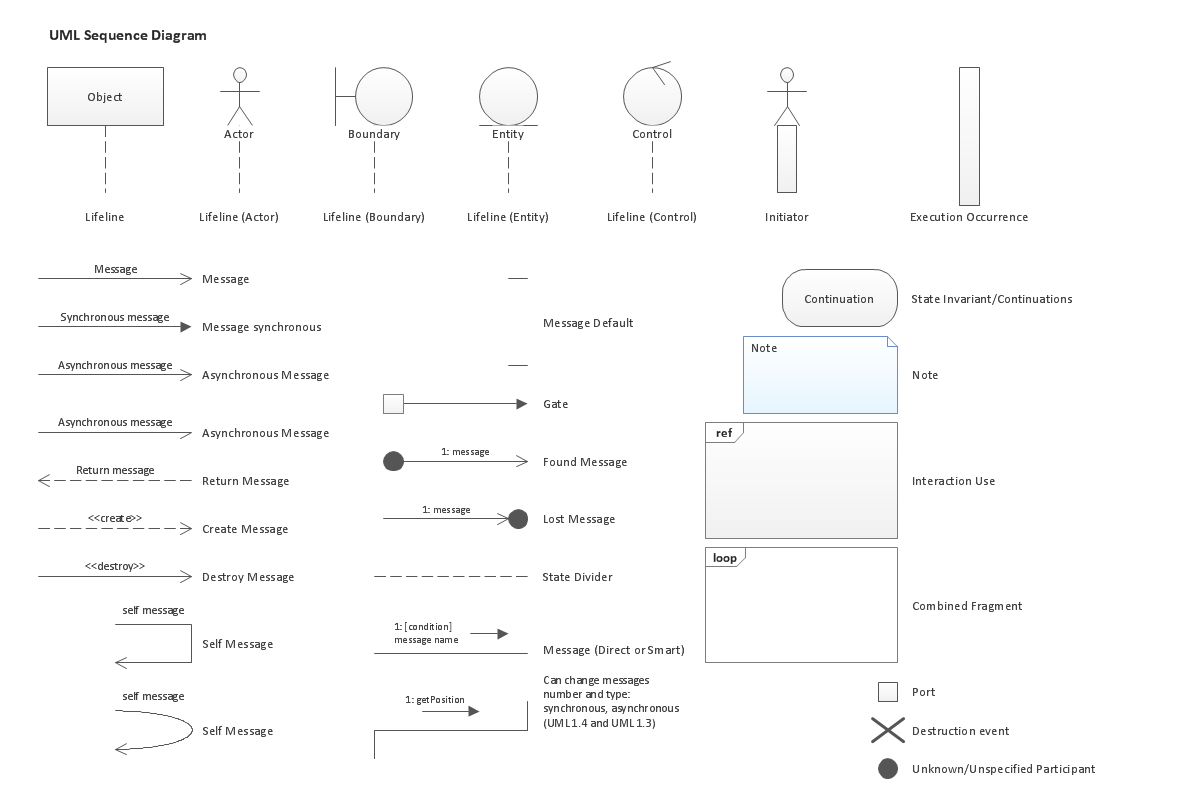
Picture: UML Sequence Diagram. Design Elements
UML Timing Diagram as special form of a sequence diagram is used to explore the behaviours of objects throughout a given period of time.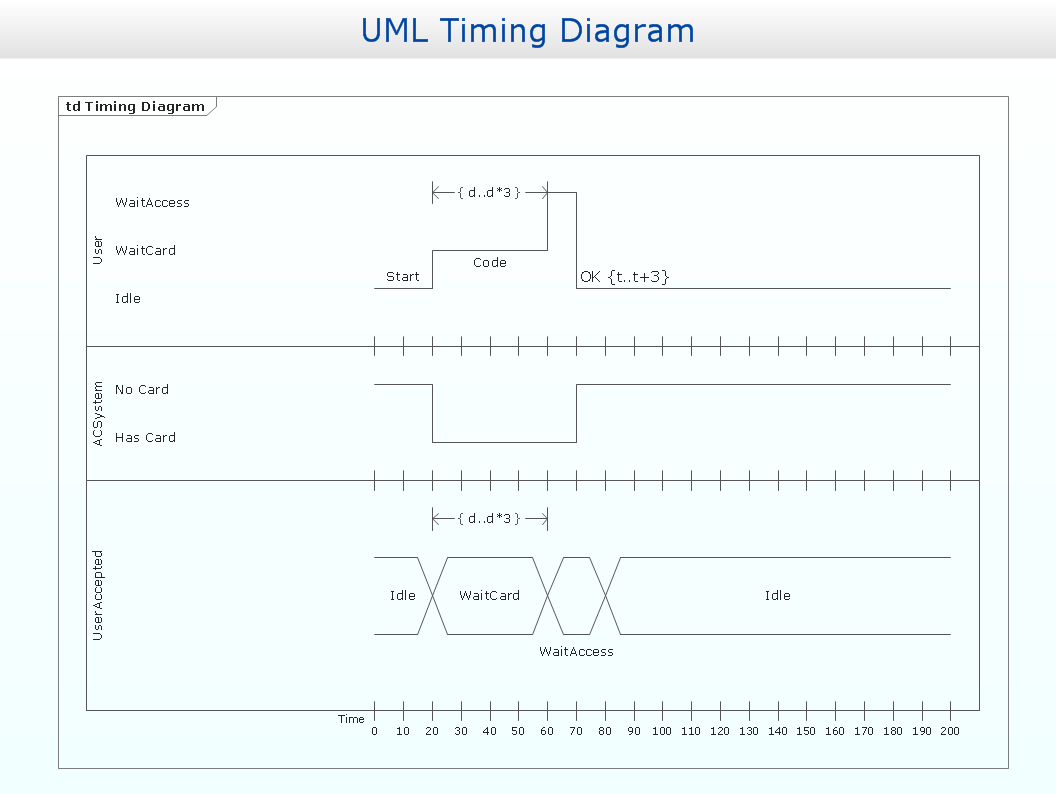
Picture: Timing diagram
Related Solution:
The UML Diagrams are widely used by software developers and software engineers. They can draw the UML Diagrams manually on the paper, but it is incredibly convenient to use the special UML diagramming software. The UML diagramming software allows you to draw the UML Diagrams in a few minutes.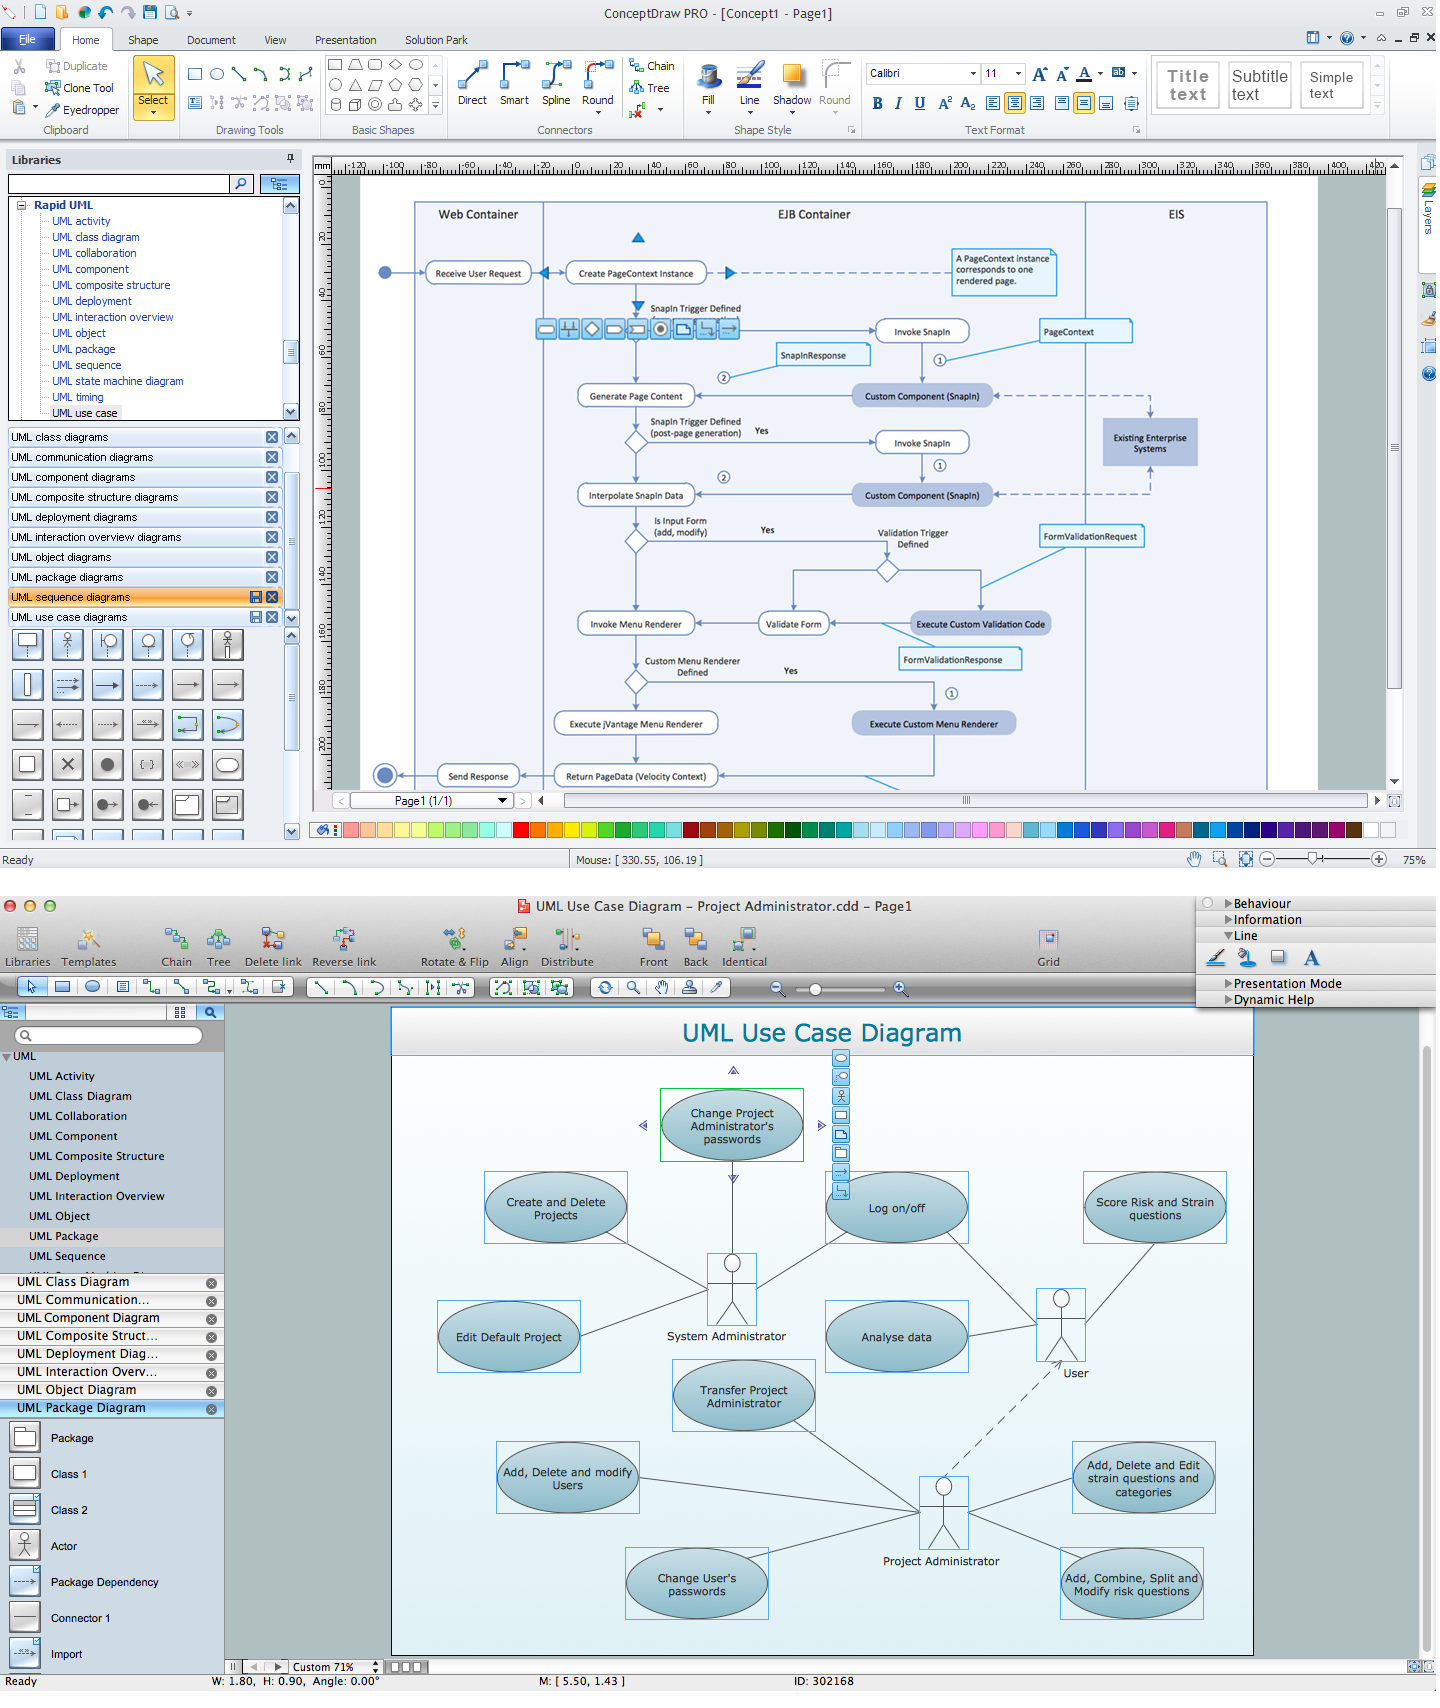
Picture: UML Diagramming Software
Related Solution:
UML Timing Diagram as special form of a sequence diagram are used to explore the behaviors of objects throughout a given period of time.
Picture: Diagramming Software for Design UML Timing Diagrams
This sample was created in ConceptDraw DIAGRAM diagramming and vector drawing software using the UML Class Diagram library of the Rapid UML Solution from the Software Development area of ConceptDraw Solution Park.
This sample describes the use of the classes, the generalization associations between them, the multiplicity of associations and constraints. Provided UML diagram is one of the examples set that are part of Rapid UML solution.
Picture: UML Class Diagram Generalization ExampleUML Diagrams
Related Solution:
The UML diagram is a powerful tool which lets visually represent all system's components, the interactions between them and relationships with external user interface.
The Rapid UML solution for ConceptDraw DIAGRAM software offers diversity of UML flowchart symbols for drawing all types of UML diagrams.
Picture: UML Flowchart Symbols
Related Solution:
UML Use Case Diagrams are used to illustrate the structure of arbitrarily complex systems and illustrates the service consumer - service provider relationship between components.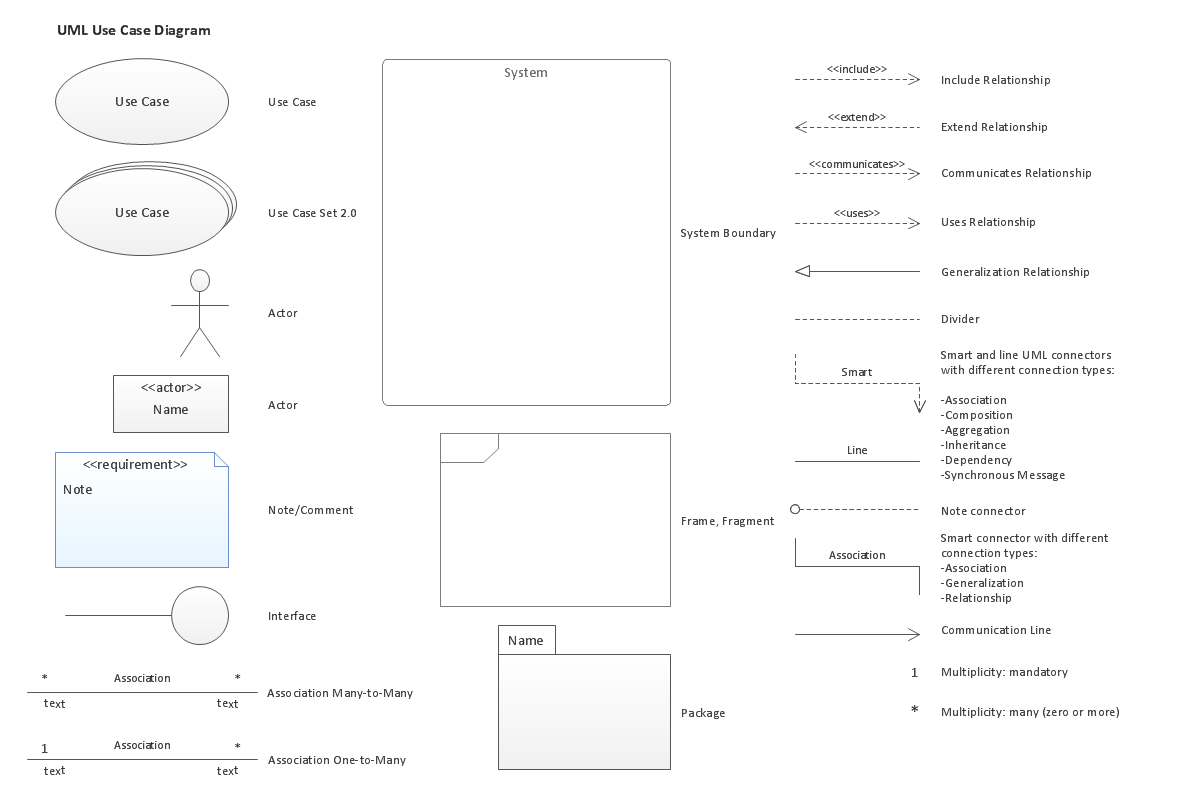
Picture: UML Use Case Diagram. Design Elements