UML Notation
Unified Modeling Language (UML)
Unified Modeling Language (UML) is a language of graphic description for object modeling in the field of software engineering. UML was created for definition, visualization, designing of software systems. UML is an open standard that uses graphic notations for creating visual models of object-oriented software systems.
There are seven types of Structure Diagrams that must be present in any modeled system:
- Class Diagram
- Component Diagram
- Composite Structure
- Deployment Diagram
- Object Diagram
- Package Diagram
The Behavior Diagrams group includes:
The subgroup of Interaction Diagrams controls the flow of control and data, and includes:
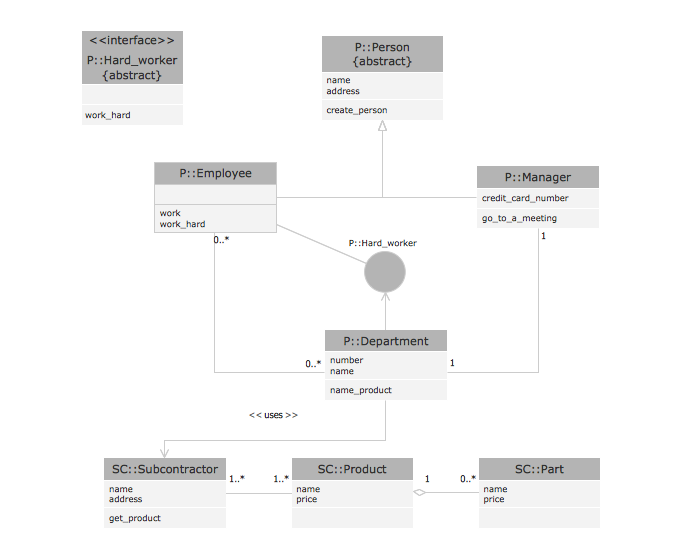
Pic. 1. UML Notation
Class Diagrams
UML Class Diagram is a type of Structure Diagrams that shows the classes of a system, attributes, operations, and the relationships between them.
Class Diagram is one of important types of UML Diagrams. UML Class Diagrams are used for static modeling of the system, for data modeling, for conceptual modeling of the application, and for modeling of the system dictionary, On the Class Diagram, Classes are represented as boxes that consist of three parts: name, attributes of the class, and operations or methods.
Use the following notations to set the visibility of a class member: Public (+), Private (-), Protected (#), Derived (/), Static (_), Package (~). Notation must be placed before the name of class member.
There are a few types of associations between objects and classes on the Class Diagrams.
Bi-directional associations are represented by a line between two classes, it is default connection between classes. Uni-directional associations are represented as the unbroken lines with an open arrowhead.
Aggregation is an association with the relation between the whole and its parts, and is represented as empty diamond on the Class Diagram.
Composition is a strong variant of aggregation, represents on as filled diamond.
Inheritance is when a child object or class assumes all properties of his parent object or class, is represented as empty triangle. There are four notations: 0..1, 1, 0..*, 1..*, that indicate the multiplicity of associations.
Package Diagrams
UML Package Diagram is a type of Structure Diagrams that represents the packages of the model and dependencies between them.
Package Diagrams are used to illustrate the layered architecture of a software system. The packages depict the different layers of a software system. To indicate the types of dependencies between the packages are used the stereotypes.
There are two special types of dependencies between the packages in UML: package import and package merge.
To design UML Package Diagrams use the following shape types:
- Package – it is the mechanism indispensable for organizing the elements and diagrams into the groups.
- Class - it is a description of logical structure of the system, its objects and their behavior in the system.
- Interface - it is a specification of the behavior.
- Object - it is an instance of class, and others.
UML Package Diagrams are very useful for working with large systems, because they allow to clearly view all the dependencies between the elements of these systems.
Object Diagrams
UML Object Diagram is a type of Structure Diagrams that shows the objects of the system and attributes, and relations between the objects at a certain moment of time.
UML Object Diagram represents a specific instance of a Class Diagram at a moment of time.
A correlated group of the Object Diagrams shows how the system will develop over the time.
Objects and links on the UML Object Diagram are represented by Instance Specification that use the slots to show the object classifier, instance name, attributes and other structural characteristics. One attribute or feature has the one corresponded slot. Links between instances are named as links. You can also use the associations of aggregation (represents as empty diamond) or composition (represents as filled diamond), and other UML entities on the UML Object Diagram.
Use Case Diagrams
UML Use Case Diagram is a type of Behavior Diagrams that displays the dependencies between the actors and use cases. UML Use Case Diagram displays the system on the conceptual level.
The purpose of a UML Use Case Diagram is to demonstrate the various types of users of a system and the different ways of their interacting with this system. Use Case Diagrams are often used together with the textual use cases and other types of diagrams.
The notation for a Use Case Diagram involves the following types of symbols:
- Use cases are represented as the horizontally shaped ovals and display the different uses.
- Actors are the people that employ the use cases and are represented on the diagram as figures of persons. Actors cannot be related each to other (except relations of generalization/inheritance).
- Associations are shown as lines between actors and use cases.
- System boundary – the box with the name and ovals (use cases) inside that sets a system scope to use cases.
- Packages that allow you to add the elements in groups.
Sequence Diagrams
UML Sequence Diagram is a type of Interaction Diagrams that describes the interactions between objects and classes that are involved in the scenario and the sequence of messages exchanged between them.
UML Sequence Diagram represents the processes and objects that occur at the same time as lifelines (parallel vertical lines), and the messages exchanged between them as horizontal arrows.
Sequence Diagrams are very popular in dynamic modeling.
Collaboration Diagrams
UML Communication Diagram in UML 2.0 (Collaboration Diagram in UML 1.x) is a type of Interaction Diagrams that displays the interactions of objects using the sequenced messages.
UML Communication Diagrams shows simultaneously the static structure and dynamic behavior of a system. Communication Diagrams involve the information taken from Class, Sequence, and Use Case Diagrams.
On the Communication Diagrams are shown the interactions between objects and the time as a separate dimension is not used, in contrast to Sequence Diagram.
UML Communication Diagrams also as UML Object diagrams use the free-form arrangement of objects and links. Messages are numbered in the chronological order. Reading of Communication Diagram starts on the message 1.0, and continues in the direction of sending messages from object to object.
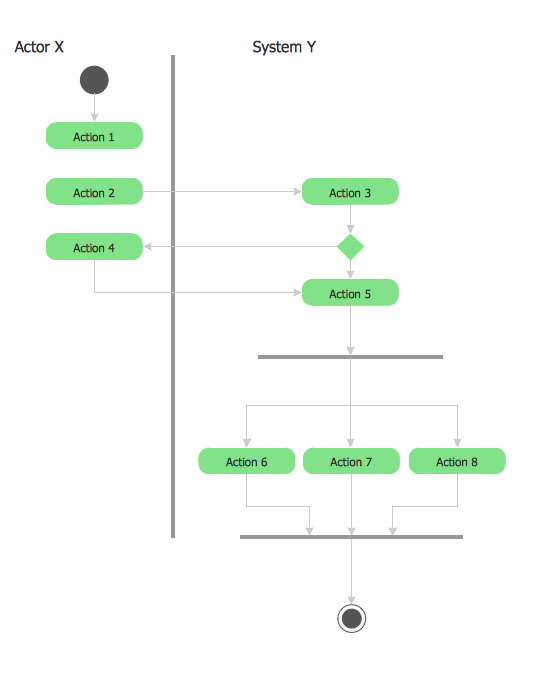
Activity Diagrams
UML Activity Diagram is a type of Behavior Diagrams that graphically describes decomposition of the some activity on the components.
Activity Diagrams are used in modeling of business processes, technological processes, sequential and parallel computations. UML Activity Diagram allows to show the sequence, branching and synchronization of processes.
To design UML Activity Diagrams use the following shape types:
- rounded rectangles to describe the actions;
- diamonds to describe decisions;
- bars to represent the start or end of the activities that occur at the same time;
- black circle to indicate the start of the workflow;
- encircled black circle to indicate the end of the workflow;
- arrows to represent the order in which activities happen.
Activity Diagrams were a specialized form of the State Diagrams in UML 1.x. In UML 2.x, the Activity Diagrams were reformed and now are based on Petri net-like semantics that allows to model a lot more situations.
Component Diagrams
UML Component Diagram is a type of Structure Diagrams that shows how components are connected to larger components or software systems, and shows the dependencies among these components.
Component-based development supposes that constructed components can be reused and replaced by some other components. Components in UML can represent logical components and physical components. The behavior of components is defined in the terms of provided interfaces and required.
There are two types of connectors linking components: assembly connectors and delegation connectors.
Assembly connector is a connector between two components that allows to connect the required interface of one component with the provided interface of another component. Thus the assembly connector is described that one component provides the services that another component requires.
A delegation connector is a connector that describes how a component realizes the specification of behavior. When a delegation connector is assigned, the signals that arrive at the port will be delegated on the internal part. To communicate with external part it is necessary to delegate signals from the internal part to a port using the delegation connector.
Deployment Diagrams
UML Deployment Diagram is a type of Structure Diagrams that shows the physical deployment of information generated by the software programs.
The information generated by the software is called “artifact”. The hardware with installed software is called “node”. Thus, UML Deployment Diagram models the physical deployment of artifacts on nodes.
UML Deployment Diagram is intended for visualization of elements and components of the program that exist only on the stage of its runtime. The development of the Deployment Diagram is the last stage of the specification of the software system model.
UML Deployment Diagram represents the nodes as boxes, and the artifacts as rectangles within the boxes. The nodes can have subnodes that are represented as nested boxes. One node on the UML Deployment Diagram can conceptually describe more than one physical node. There are two types of nodes: device nodes and execution environment nodes.
Device nodes are the computing resources with capability of processing memory and executing of software. An execution environment node (EEN) is a computer system that is located inside a device node.
The other shapes the most used in UML Deployment Diagrams are:
- Communication path - a line that connect two device nodes and represents communications between them.
- Package - a file shaped box that groups together all the device nodes.
- Data Store, Frames, Components UML, and others.
State Machine Diagrams
UML State Machine Diagram is a type of Behavior Diagrams that displays the finite state machine with states and state transitions.
UML State Machine Diagram is a realization of the mathematical concept of a finite state machine. State Machine Diagram is an oriented graph for finite state machine in what tops represent states and connectors show transitions between two states. States are represented as rounded rectangles and state transitions as arrows. The Initial State of the system is represented as black circle, and Final State as encircled black circle.
UML State Machine Diagram is the object-based version of Harel State Chart that is extended by UML. UML State Machines keep the main benefits of traditional finite state machines and also overcome their restrictions. UML State Machines extend the notion of actions.
Timing Diagrams
UML Timing Diagram in the UML 2.0 is a specific type of Interaction Diagrams that describes the timing constraints. UML Timing Diagrams describes the behaviors of the objects during a certain period of time.
UML Timing Diagram is an inverted form of a Sequence Diagram – the axes are reversed thus the time is passing on the x-axis from left to right, and the different components of the system which interact with each other are arranged on the y-axis.
Interaction Overview Diagrams
UML Interaction Overview Diagram is a type of Interaction Diagrams that describes an overview in which the nodes represent interaction diagrams.
Interaction Overview Diagrams look the same as Activity Diagrams. The difference is that: on the Interaction Overview Diagram every individual activity describes as a frame that can include the nested Interaction Diagrams. This feature makes the Interaction Overview Diagrams useful to deconstruct the complex scenarios.
Composite Structure Diagrams
UML Composite Structure Diagram is a type of Structure Diagrams that shows the internal structure of a class and the interactions of elements of the internal structure of the class.
The Composite Structure Diagrams appeared in UML 2.0 to supplement the existing artifacts such as classes. A Composite Structure Diagram consists of the set of elements that are connected and collaborate at the runtime. Each element executes the defined role in this collaboration.
UML Composite Structure Diagram includes internal parts; ports through these parts interact between each other and with the outside world; connectors between parts or ports; collaborations and structured classifier.

The Rapid UML Solution for ConceptDraw DIAGRAM provides templates and samples for each type of UML diagram that help you to create the UML Diagrams in one moment.