Pie Chart Software
A common enough method of graphic representation of the structure of statistical collections is a pie chart, as the whole idea is very clearly expressed in a circle, which represents the entire set. The relative magnitude of each value is represented as a circle sector, area of which corresponds to the contribution of this value in the sum of values. This type of diagramming is convenient to use when you need to show the value of each share in the total volume. Sectors may be depicted in a general circle or be separately arranged at a small distance from each other.
Pie charts are widely used in the reports, as they are visually appealing. The other side of the coin is, however, that pie charts are very simplified chart type that can not provide data well. Consider the possibility to use pie charts only after data processing, which results in a small number of data points.
For pie charts, each data group is displayed in a separate slice on the diagram. It is necessary for a pie chart to add at least one data field and one category field. If you add more than one data field to the pie chart, two data fields are displayed in the same graph.

Pic 1. Pie Chart Examples
While calculating the pie chart shares some values like empty, negative or zero are not taken into account. Therefore, these values are not displayed in the pie chart. If you want to visualize the values of these types in the diagram, you should choose a chart type that is different from a pie chart.
Unlike most other types of charts, the legend to the pie chart shows the individual data points instead of individual series.
At least two values are required for a pie chart to allow valid comparison between the two proportional shares.
If a pie chart contains only one color, make sure that you have a category field to group by. If the pie chart contains no categories, it performs statistical processing of the data fields values to get one a value for display.
To design pie and donut charts use ConceptDraw DIAGRAM diagramming and vector drawing software extended with Pie Charts solution from Graphs and Charts area of ConceptDraw DIAGRAM Solution Park.

Pic 2. Pie Chart in ConceptDraw STORE
The Pie Charts solution provides templates, samples and a library of vector stencils for quick and easy drawing pie and donut charts.
The shapes library Pie Charts contains ready-to-use predesigned pie and donut chart objects you can simply drop into your document, quickly set up data and obtain professional looking different types of pie and donut charts: percentage and absolute values pie charts, separated pie and exploded pie charts, pie charts with shifted slices, percentage and absolute values donut (doughnut, ring) charts, arrow ring charts.

Pic 3. Pie Chart Software
ConceptDraw DIAGRAM software with Pie Charts solution helps to create pie and donut charts for effective displaying proportions in statistics, business and mass media for composition comparison, i.e. for visualization of part percentage inside one total.

Pic 4. Pie Chart Library
Free Download Pie Chart Software and View All Examples
Using pie charts always leaves a free space on your page or slide. You can use this space to add illustrations or text labels provide your audience with additional information which may help your audience understand the subject.

Pic 5. Percentage pie chart. DA determinations
This example was created in ConceptDraw DIAGRAM using the Pie Charts Library from the Pie Charts Solution. An experienced user spent 5 minutes creating this sample.
TEN RELATED HOW TO's:
Complete set of bar chart examples is produced using ConceptDraw software. Surfing bar chart examples you can find an example that is the best for your case.
Picture: Bar Chart Examples
Related Solution:
ConceptDraw provides some interactive xy chart and scatter graph symbols that offers advanced features yet is simple to use.
Picture: Scatter Graph Charting Software
Related Solution:
ConceptDraw gives the ability to draw Flowchart documents. Flowcharts solutionis a powerful tool that extends ConceptDraw application for drawing business flowcharts.
ConceptDraw DIAGRAM vector diagramming and business graphics software enhanced with with templates, green and interactive flowchart makers, samples and stencil libraries from ConceptDraw Solution Park which all focused to help with drawing flowcharts, block diagrams, bar charts, histograms, pie charts, divided bar diagrams, line graphs, area charts, scatter plots, circular arrows diagrams, Venn diagrams, bubble diagrams, concept maps, and others.
Picture: The Best Flowchart Software Available
Related Solution:
Diagrams are a very important part of modern life. With the help of flow diagram software, a lot of companies can promote their ideas at the market. Its usefulness is totally doubtless.
This is a flow chart of the invoice payment flow. This flowchart details decrypts all stages of the process of obtaining and paying bills. It is a description of the universal process - such steps performs accounting departments of almost any organization. Since every business no matter what it does is a consumer of some goods or services. The given flow chart was made using ConceptDraw DIAGRAM software and the Diagrams solution for making flowcharts of any kind.
Picture: Flow Diagram Software
Related Solution:
SWOT matrix is a structured planning method used to evaluate the strengths, weaknesses, opportunities and threats involved in a project or in a business venture. ConceptDraw DIAGRAM diagramming and vector drawing software extended with SWOT and TOWS Matrix Diagrams Solution from the Management Area will help you design SWOT Matrix of any complexity quick and easy.
Picture: SWOT Matrix
Related Solution:
High competition among the restaurants at the food court requires original design ideas. To attract visitors and increase sales are used many kinds of advertising products, brightly colored signboards, menus and show-cases, often are used the molds of beautifully decorated dishes. Now designing of colorful F&B (food and beverage) materials is easier than ever thanks to the ConceptDraw DIAGRAM diagramming and vector drawing software extended with Food Court Solution from the Food and Beverage Area of ConceptDraw Solution Park.
Picture: F&B
Related Solution:
All these bar chart templates are included in the Bar Graphs solution.
You can quickly rework these bar graph templates into your own charts by simply changing displayed data, title and legend texts.
Picture: Bar Chart Template for Word
Related Solution:
ConceptDraw DIAGRAM is a powerful intelligent vector graphics engine that can be used to create basic diagrams including flowcharts, charts, workflows, flowcharts, organizational charts, business diagram, learn business diagrams, flow diagrams.
Picture: The Best Mac Software for Diagramming or Drawing
Related Solution:
Japan is an island nation in East Asia. Located in the Pacific Ocean, it lies to the east of the Sea of Japan, China, North Korea, South Korea and Russia, stretching from the Sea of Okhotsk in the north to the East China Sea and Taiwan in the south.
The vector stencils library Japan contains contours for ConceptDraw DIAGRAM diagramming and vector drawing software. This library is contained in the Continent Maps solution from Maps area of ConceptDraw Solution Park.
Picture: Geo Map - Asia - Japan
Related Solution:
While studying, many of the students encounter the necessity of remaking class projects, over and over. To facilitate this process you can use special electrical and telecom plan software, which helps altering projects in several clicks. Using templates will fasten your work, and you will have more free time.
This sample represents an electrical and telecommunication floor plan. Electrical and telecom floor plans contain a floor plan , on which imposed the layout of electrical, and telecommunications equipment. They shows electrical and telecom details regarding the current floor of a building: lightening, fixtures, wires, outlets, circuit panels, etc. Using of standart notation of electrical and telecommunication symbols makes the plan understandable for engineers, architects, constructors, specialist in electricity and telecommunications.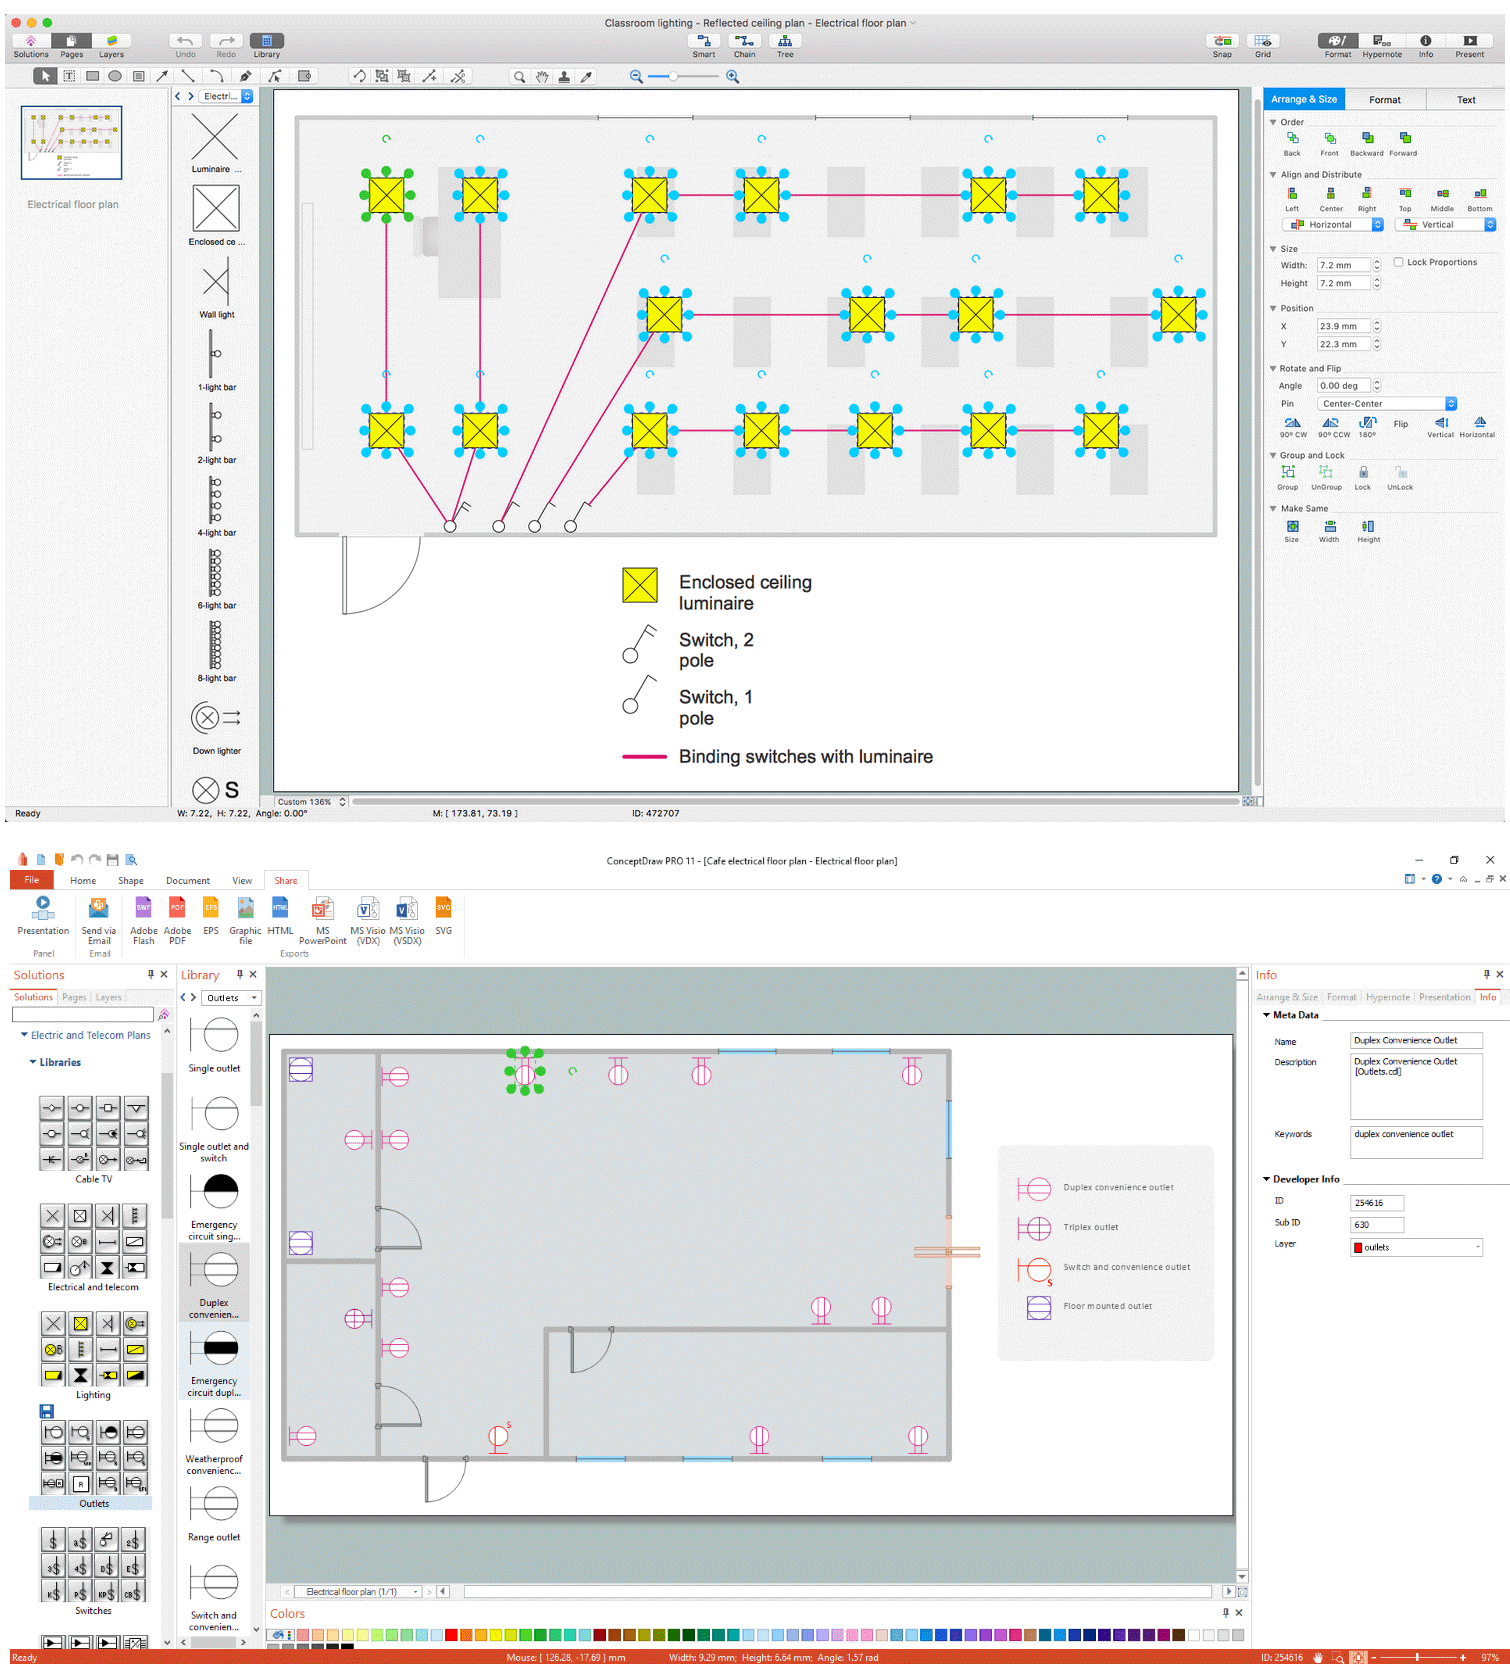
Picture: Electrical and Telecom Plan Software
Related Solution: