Made with
ConceptDraw
DIAGRAM 18

Soccer (Football) Formation

The soccer (football) formation is an arrangement of the players on the pitch and their behavior during the game to meet the objectives set by the soccer coach. The different formations are used depending on the team goals. Thanks to a certain starting position of the player it is possible to define its main tasks in the match. The numbers in the designation of the formation mean respectively: the number of defenders, midfielders and forwards.

Using diagrams is the easiest way to explain the soccer formations. The Soccer solution from the Sport area of ConceptDraw Solution Park is designed as a tool that helps you produce the soccer diagrams in a few minutes. The predesigned samples of the Soccer solution for ConceptDraw DIAGRAM depict the most popular formation diagrams.

Use the "Soccer (Football) Fields" and "Soccer (Football) Positions" libraries from the Soccer solution and follow the next steps to create your own soccer-related drawing quick and easy:

  • From the "Soccer (Football) Fields" library drop a field object to your document;
  • From the "Soccer (Football) Positions" library drop all position objects you need to your document;
  • Place positions on the field according to your drawing idea;
  • Add arrows or text labels if needed.
Soccer (Football) Formation *

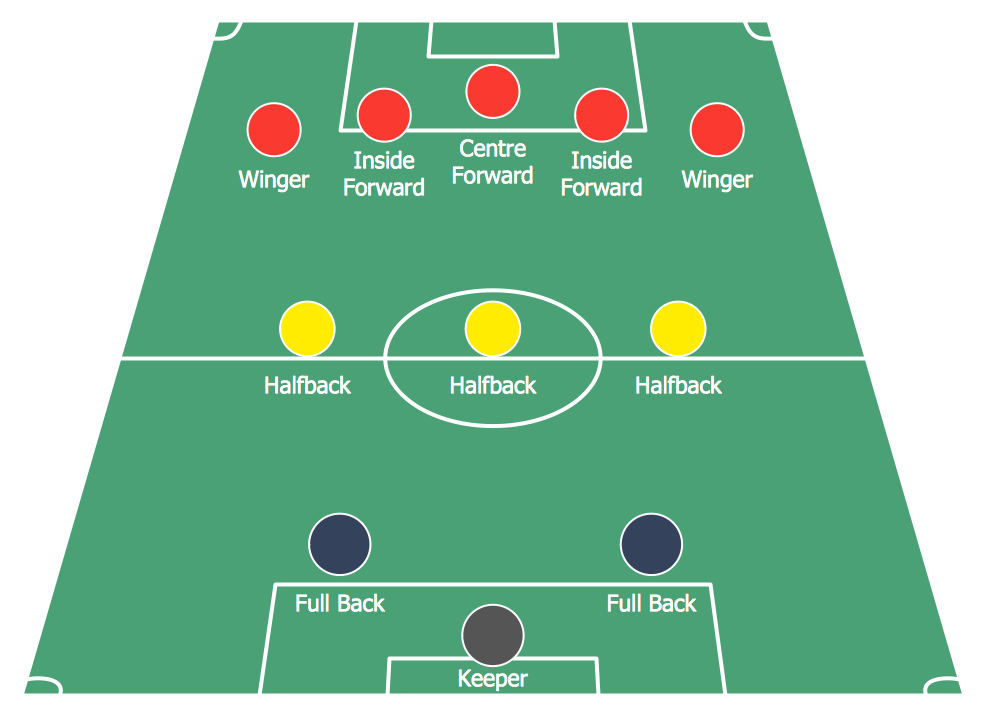
Sample 1. Soccer (Football) Formation 2—3—5 Pyramid

This sample shows the 2–3–5 formation that is also known as the "Pyramid". By the 1890s, it was the standard formation in England and then it was spread all over the world. In this formation was reached the balance between the attack and defense.

Soccer (Football) Formation 3—2—5 WM

Sample 2. Soccer (Football) Formation 3—2—5 WM

On this sample you can see the soccer formation 3–2–5 WM. The WM system was created in 1920s by Herbert Chapman of Arsenal. Was reduced the number of opposition players and was introduced a centre-back to stop the opposing centre-forward. The WM system was subsequently adapted by several English sides.

Soccer (Football) Formation 3—4—3

Sample 3. Soccer (Football) Formation 3—4—3

This sample shows the formation 3–4–3 that is used by the offensive teams, for example by Liverpool under Rafael Benitez during the second half of the 2005 UEFA Champions League Final. There are only three defenders. So if the opposing team will break through the midfield, they will have a great chance to score.

Soccer (Football) Formation 4—3—3

Sample 4. Soccer (Football) Formation 4—3—3

The soccer formation 4–3–3 that you see on this sample was developed from the 4–2–4. The Brazilian national team in the 1962 World Cup was played 4–3–3. The three midfielders move laterally across the field as a coordinated unit and play together to protect the defense. The three forwards split across the field to spread the attack. The 4-3-3 formation is very useful for ball retention and for a short passing game.

Soccer (Football) Formation 4—4—1—1

Sample 5. Soccer (Football) Formation 4—4—1—1

This sample demonstrates the formation 4-4-1-1. One of the strikers plays as a "second striker" ("in the hole"). The second striker is a playmaker that can easy drop into midfield to pick up the ball before running it.

Soccer (Football) Formation 4—4—2

Sample 6. Soccer (Football) Formation 4—4—2

On this sample you can see the soccer formation 4–4–2 that was successfully used by Fabio Capello that won three European Cups, two Intercontinental Cups, and three UEFA Super Cups between 1988 and 1995. And also Carlo Ancelotti's Milan used it on the UEFA Champions League where he won the final in 2003 and made runners-up in 2005. The formation 4–4–2 has only two forwards and is defensive formation. The team forms the game on the counter-attacks.

The samples you see on this page were created in ConceptDraw DIAGRAM using the Soccer Solution. They demonstrate the solution's capabilities and the professional results you can achieve. An experienced user spent no more than 5 minutes creating every of these samples.

All source documents are vector graphic documents. They are available for reviewing, modifying, or converting to a variety of formats (PDF file, MS PowerPoint, MS Visio, and many other graphic formats) from the ConceptDraw STORE. The Soccer Solution is available for all ConceptDraw DIAGRAM or later users.


TEN RELATED HOW TO's:
Explaining offensive strategies of American Football is practically impossible without drawing a diagram. If you need to do this more than once you have to choose an appropriate tool allows you to change diagrams easily. ConceptDraw DIAGRAM extended with the Football Solution is the best choice for this case.Offensive Strategy — Spread Offense Diagram *
Picture: Offensive Strategy — Spread Offense Diagram
Related Solution:
Computer networks nowadays are spread all across the world. The large number of parameters, such as geographic scale or communication protocols, can divide networks. One of the most common types of networks is called local area network (LAN). It convenient to represent network examples by means of diagrams. This local area network (LAN) diagram provides an easy way to see the way the devices in a local network are interacted. The diagram uses a library containing specific symbols to represent network equipment , media and the end-user devices such as computers (PC, mac, laptop) , network printer, hubs, server and finally a modem. There are two types of network topologies: physical and logical. The current diagram represents precisely a physical type of LAN topology because it refers to the physical layout of a local network equipment.Local area network (LAN) diagram
Picture:
What is a Local Area Network?
Examples of LAN Diagrams
Related Solution:
Thanks to Baseball solution all you need is just drag and drop ready-to-use positions objects to a template contains baseball field, and place positions on the field.Baseball Diagram — Defence Positions
Picture: Baseball Diagram — Defence Positions
Related Solution:
There are many tools to manage a process or to illustrate an algorithm or a workflow. Flowcharting is one of those tools. However, it may be difficult to show complex processes that require multiple attributes or several people in a simple flowchart, so a cross-functional flowchart would be a solution for that situation. To create such flowchart, group processes and steps to labeled rows or columns, and divide those groups with horizontal or vertical parallel lines. It is worth mentioning that there are different types of cross-functional flowcharts, like opportunity or deployment flowchart. This diagram shows a cross-functional flowchart that was made for a trading process. It contains 14 processes, distributed through 5 lines depicting the participants who interact with the process. Also there are connectors that show the data flow of information between processes. The cross-functional flowchart displays a detailed model of the trading process, as well as all participants in the process and how they interact with each other. The lines in the flowchart indicates the position, department and role of the trading process participants.Cross-Functional Flowchart
Picture: Cross-Functional Flowchart
Related Solution:
What is landscape design? It's a floor plan but for an outdoor area. Same as a floor plan, a landscape design represents visually any site using scaled dimensions. The main purpose of landscape design is to plan the layout for an outdoor area no matter is it a personal site plan for your home or a commercial plan for business. It may also be handful when a new installation, repair or even an outdoor event is planning. It helps to calculate time and decide which materials should be used in your project. Landscape designs perfectly gives the property owner and landscape contractor better vision for cost estimation, helping to ensure the project time and budget.How to Draw a Landscape Design Plan *
Picture: How to Draw a Landscape Design Plan
Related Solution:
You can see the samples representing the 2014 FIFA World Cup schedules and tournament tables for each of eight groups. These samples was created in ConceptDraw DIAGRAM using the “FIFA World Cup 2014 team flags”, “Soccer pictograms” and “Soccer silhouettes” libraries from the Soccer solution from the Sport area of ConceptDraw Solution Park.Football – 2014 FIFA World Cup Standings Group *
Picture: Football – 2014 FIFA World Cup Standings Group
Related Solution:
In ConceptDraw DIAGRAM you can produce ice hockey diagrams of any complexity for any presentaion needs, using a combination of tools. To adopt the sample below for presentation needs place positions and arrows onto different layers of your document and then make them visible one by one during a presentation.Ice Hockey Diagram — Defensive Strategy — Neutral Zone Trap *
Picture: Ice Hockey Diagram — Defensive Strategy — Neutral Zone Trap
Related Solution:
Explaining the soccer strategies and techniques is practically impossible without drawing a diagram. ConceptDraw DIAGRAM diagramming and vector drawing software extended with Soccer solution from the Sport area of ConceptDraw Solution Park is a very convenient and useful tool for designing the soccer-related diagrams.Soccer (Football) Diagram Software *
Picture: Soccer (Football) Diagram Software
Related Solution:
It’s very convenient to explain the different tactics and positions using the visual drawings. ConceptDraw DIAGRAM software extended with the Soccer solution from the Sport area of ConceptDraw Solution Park provides libraries, templates and samples allowing specialists or soccer fans to draw the soccer-related diagrams and schemas of any complexity in a few minutes.Soccer (Football) Offside *
Picture: Soccer (Football) Offside
Related Solution:
Meeting ice hockey rules one should learn ice hockey rink terms, lines, zones etc. ConceptDraw DIAGRAM is an advanced drawing software that allows you produce ice hockey rink depiction of any complexity, from simple sketch drawing to detailed one as on example below.Ice Hockey Rink Dimensions *
Picture: Ice Hockey Rink Dimensions
Related Solution:
ConceptDraw
DIAGRAM 18