
Sample 1. How to Draw ER Diagrams
The easiest and fastest way of drawing ER diagrams is to design them on the base of ready-to-use Chen ERD and Crow's Foot ERD templates. They both are represented at ConceptDraw STORE.

Example 2. ERD Templates
Use the corresponding template and other objects from the ERD Chen's Notation and ERD Crow's Foot Notation libraries to design your Entity-Relationship Diagram in a few minutes.

Example 3. Entity-Relationship Diagram, Crow's Foot Notation
Another way of easy drawing ER diagrams in ConceptDraw DIAGRAM is:
- create new ConceptDraw document,
- add required objects from the libraries,
- connect the objects with Smart Connector tool from the Home toolbar,
- use the Action menus of the objects to change diagram elements,
- apply Line, Fill, Shadow and Text tools to format diagram objects.

Example 4. Entity-Relationship Diagram, Chen's Notation
The ER Diagrams you see on this page were created in ConceptDraw DIAGRAM using the libraries from Entity-Relationship Diagram (ERD) solution. An experienced user spent 10-15 minutes creating each of these samples.
Use the Entity-Relationship Diagram (ERD) Solution for ConceptDraw DIAGRAM software to demonstrate how to draw ER Diagrams fast, easy and effective.
All source documents are vector graphic documents. They are available for reviewing, modifying, or converting to a variety of formats (PDF file, MS PowerPoint, MS Visio, and many other graphic formats) from the ConceptDraw STORE. The Entity-Relationship Diagram (ERD) Solution is available for all ConceptDraw DIAGRAM or later users.
TEN RELATED HOW TO's:
This sample was created in ConceptDraw DIAGRAM diagramming and vector drawing software using the Flowcharts solution from the Diagrams area of ConceptDraw Solution Park.
This sample shows the Flowchart of the Subprime Mortgage Crisis. This Flowchart describes the decline in housing prices when the housing bubble burst and what it caused on the housing and financial markets. You can also see the Government and Industry responses in this crisis situation.
Picture: Flowchart on Bank. Flowchart Examples
Related Solution:
Complexity of databases increases day by day, due to this the Entity relationship models and E-R diagrams become more and more popular, and now are an important part of database design. E-R diagrams created at ConceptDraw DIAGRAM allow visually and graphically represent structure and design of databases.
Picture: E-R Diagrams
Related Solution:
Event-Driven Process Chain Diagrams is using for improvement throughout an organisation.
ConceptDraw DIAGRAM - software that reduces the time needed to create a EPC diagrams.
Picture: The Building Blocks Used in EPC Diagrams
Related Solution:
UML Activity Diagram illustrates the business and operational step-by-step workflows of components in a system and shows the overall flow of control. You can use the appropriate stencils of UML notation from UML Activity library with 37 objects. ConceptDraw is ideal for software designers and software developers who need to draw UML Activity Diagrams.
Use ConceptDraw DIAGRAM diagramming and vector drawing software enhanced with Rapid UML solution from ConceptDraw Solution Park to create your own UML activity diagrams that show the business and operational workflows of components and overall flow of control in your systems. Such software provides coloring UML diagrams for various purposes and simplifying work of the engineers.
Picture: UML Activity Diagram
Related Solution:
Chemical and Process Engineering solution contains variety predesigned process flow diagram elements relating to instrumentation, containers, piping and distribution necessary for chemical engineering, and can be used to map out chemical processes or easy creating various Chemical and Process Flow Diagrams in ConceptDraw DIAGRAM.
Picture: Process Flow Diagram Symbols
Related Solution:
When we think of an hierarchy, we intuitively imagine a pyramid. Thus, a lot of management tools use pyramid charts as examples or illustrations of various documents or models. You can create any type of triangle diagram using ConceptDraw DIAGRAM.
A triangle (pyramid) diagram is often used in marketing to show the data hierarchy. This pyramid diagram represents the Top Brand Model. It illustrate the model of rebranding strategy. It can be used by marketing agency dealing with rebranding strategies development. It’s critical for marketing diagrams to be both clear and eye catching. ConceptDraw Pyramid diagrams solution meet all these requirements and can be successfully applied for creating and presenting various marketing pyramidal diagrams.
Picture: Pyramid Chart Examples
Related Solutions:
If you want to find a way to understand complex things in minutes, you should try to visualize data. One of the most useful tool for this is creating a flowchart, which is a diagram representing stages of some process in sequential order. There are so many possible uses of flowcharts and you can find tons of flow charts examples and predesigned templates on the Internet. Warehouse flowchart is often used for describing workflow and business process mapping. Using your imagination, you can simplify your job or daily routine with flowcharts.
Warehouse flowcharts are used to document product and information flow between sources of supply and consumers. The flowchart provides the staged guidance on how to manage each aspect of warehousing and describes such aspects as receiving of supplies; control of quality; shipment and storage and corresponding document flow. Warehouse flowchart, being actual is a good source of information. It indicates the stepwise way to complete the warehouse and inventory management process flow. Also it can be very useful for an inventory and audit procedures.
Picture: Flow Chart Example: Warehouse Flowchart
Related Solution:
Business Process Modeling Notation -BPMN- is a set of standard symbols that allow you to create a graphical view of a business process. The symbols were developed to help users develop standard, unified structure of processes, and any messages shared between these processes. This is business process improvement tools.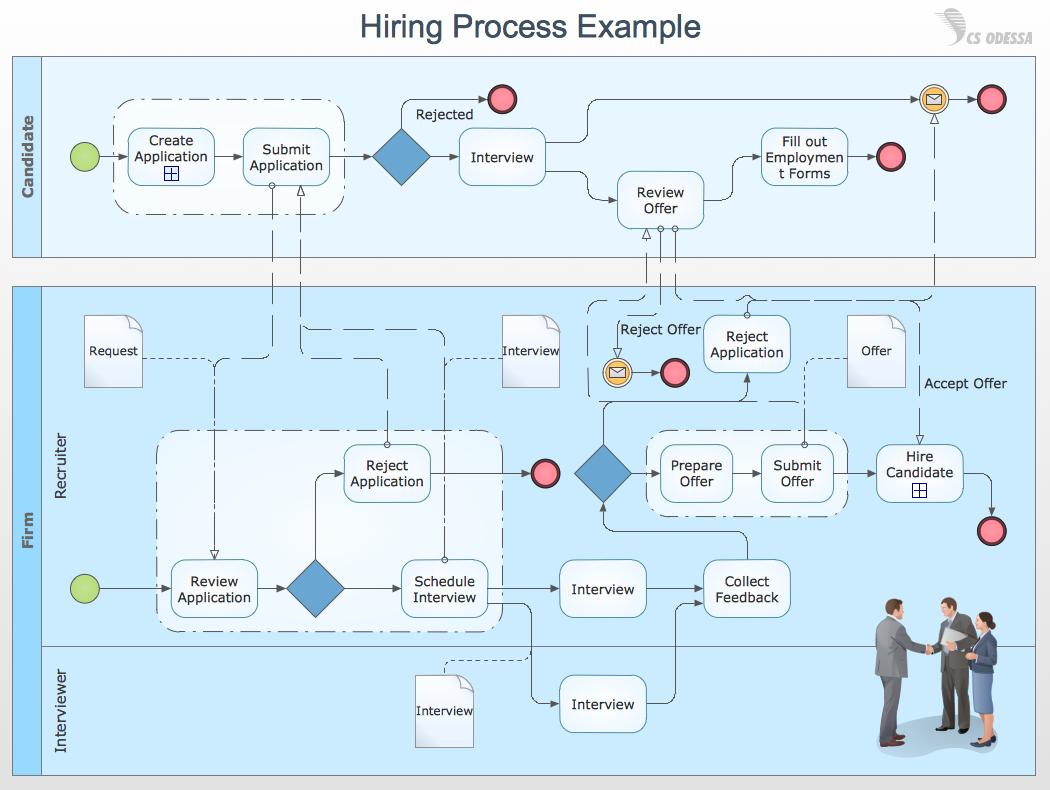
Picture: Business Process Modeling with ConceptDraw
Related Solution:
Try ConceptDraw program, the perfect drawing tool for creating all kinds of great-looking drawings, charts, graphs, and illustrations.
Picture: Basic Diagramming
Related Solution:
UML Diagrams Social Networking Sites Project. This sample was created in ConceptDraw DIAGRAM diagramming and vector drawing software using the UML Use Case Diagram library of the Rapid UML Solution from the Software Development area of ConceptDraw Solution Park.
This sample shows the Facebook Socio-health system and is used at the projection and creating of the social networking sites.
Picture: UML Use Case Diagram Example. Social Networking Sites Project
Related Solution:


