
Example 1. Healthy Foods — Five Food Groups
Variety of predesigned objects of healthy foods is represented by 8 libraries included in Health Food Solution. These libraries contain 238 ready-to-use clipart specially developed for ConceptDraw DIAGRAM users. All they are vector, so you can easy resize them without loss of quality, change their color, combine several clipart to make your health food infographics and illustrations more interesting, bright and attractive.
ConceptDraw DIAGRAM gives you all needed tools to design your health food images from the blank sheet, but you can also use as the base or as the source of inspiration ready samples and examples offered in ConceptDraw STORE.

Example 2. Health Food Solution in ConceptDraw STORE
You can also use clipart from the libraries of other solutions included in Food and Beverage area to make your drawings yet more attractive and bright.

Example 3. Healthy Foods — USDA Food Pyramid
The healthy foods samples you see on this page were created in ConceptDraw DIAGRAM software using the Health Food Solution. An experienced user spent 10-15 minutes creating each of these samples.
Use the predesigned objects from the libraries of Health Food Solution for ConceptDraw DIAGRAM to illustrate the healthy food recipes and design attractive healthy foods pictures quick, easy and effective.
All source documents are vector graphic documents. They are available for reviewing, modifying, or converting to a variety of formats (PDF file, MS PowerPoint, MS Visio, and many other graphic formats) from the ConceptDraw STORE. The Health Food Solution is available for all ConceptDraw DIAGRAM users.
TEN RELATED HOW TO's:
Tracking Olympic results in visual format is the most modern way to deliver statistics to a broad audience. This is a good example of an illustrated table you may easily modify, print, or publish on web from ConceptDraw Winter Sports solution.
Picture: Winter Sports Vector Clipart. Medal Map. Spatial Infographics
Related Solution:
Mind Map Food - This sample was created with ConceptDraw MINDMAP mind mapping software.
This sample shows the mind map about the such fast food as Hamburger. This sample narrates about the hamburger’s history, ingredients and preparation. You can use this sample at the cooking, in the fast food cafes, on the factories of the fast preparation products.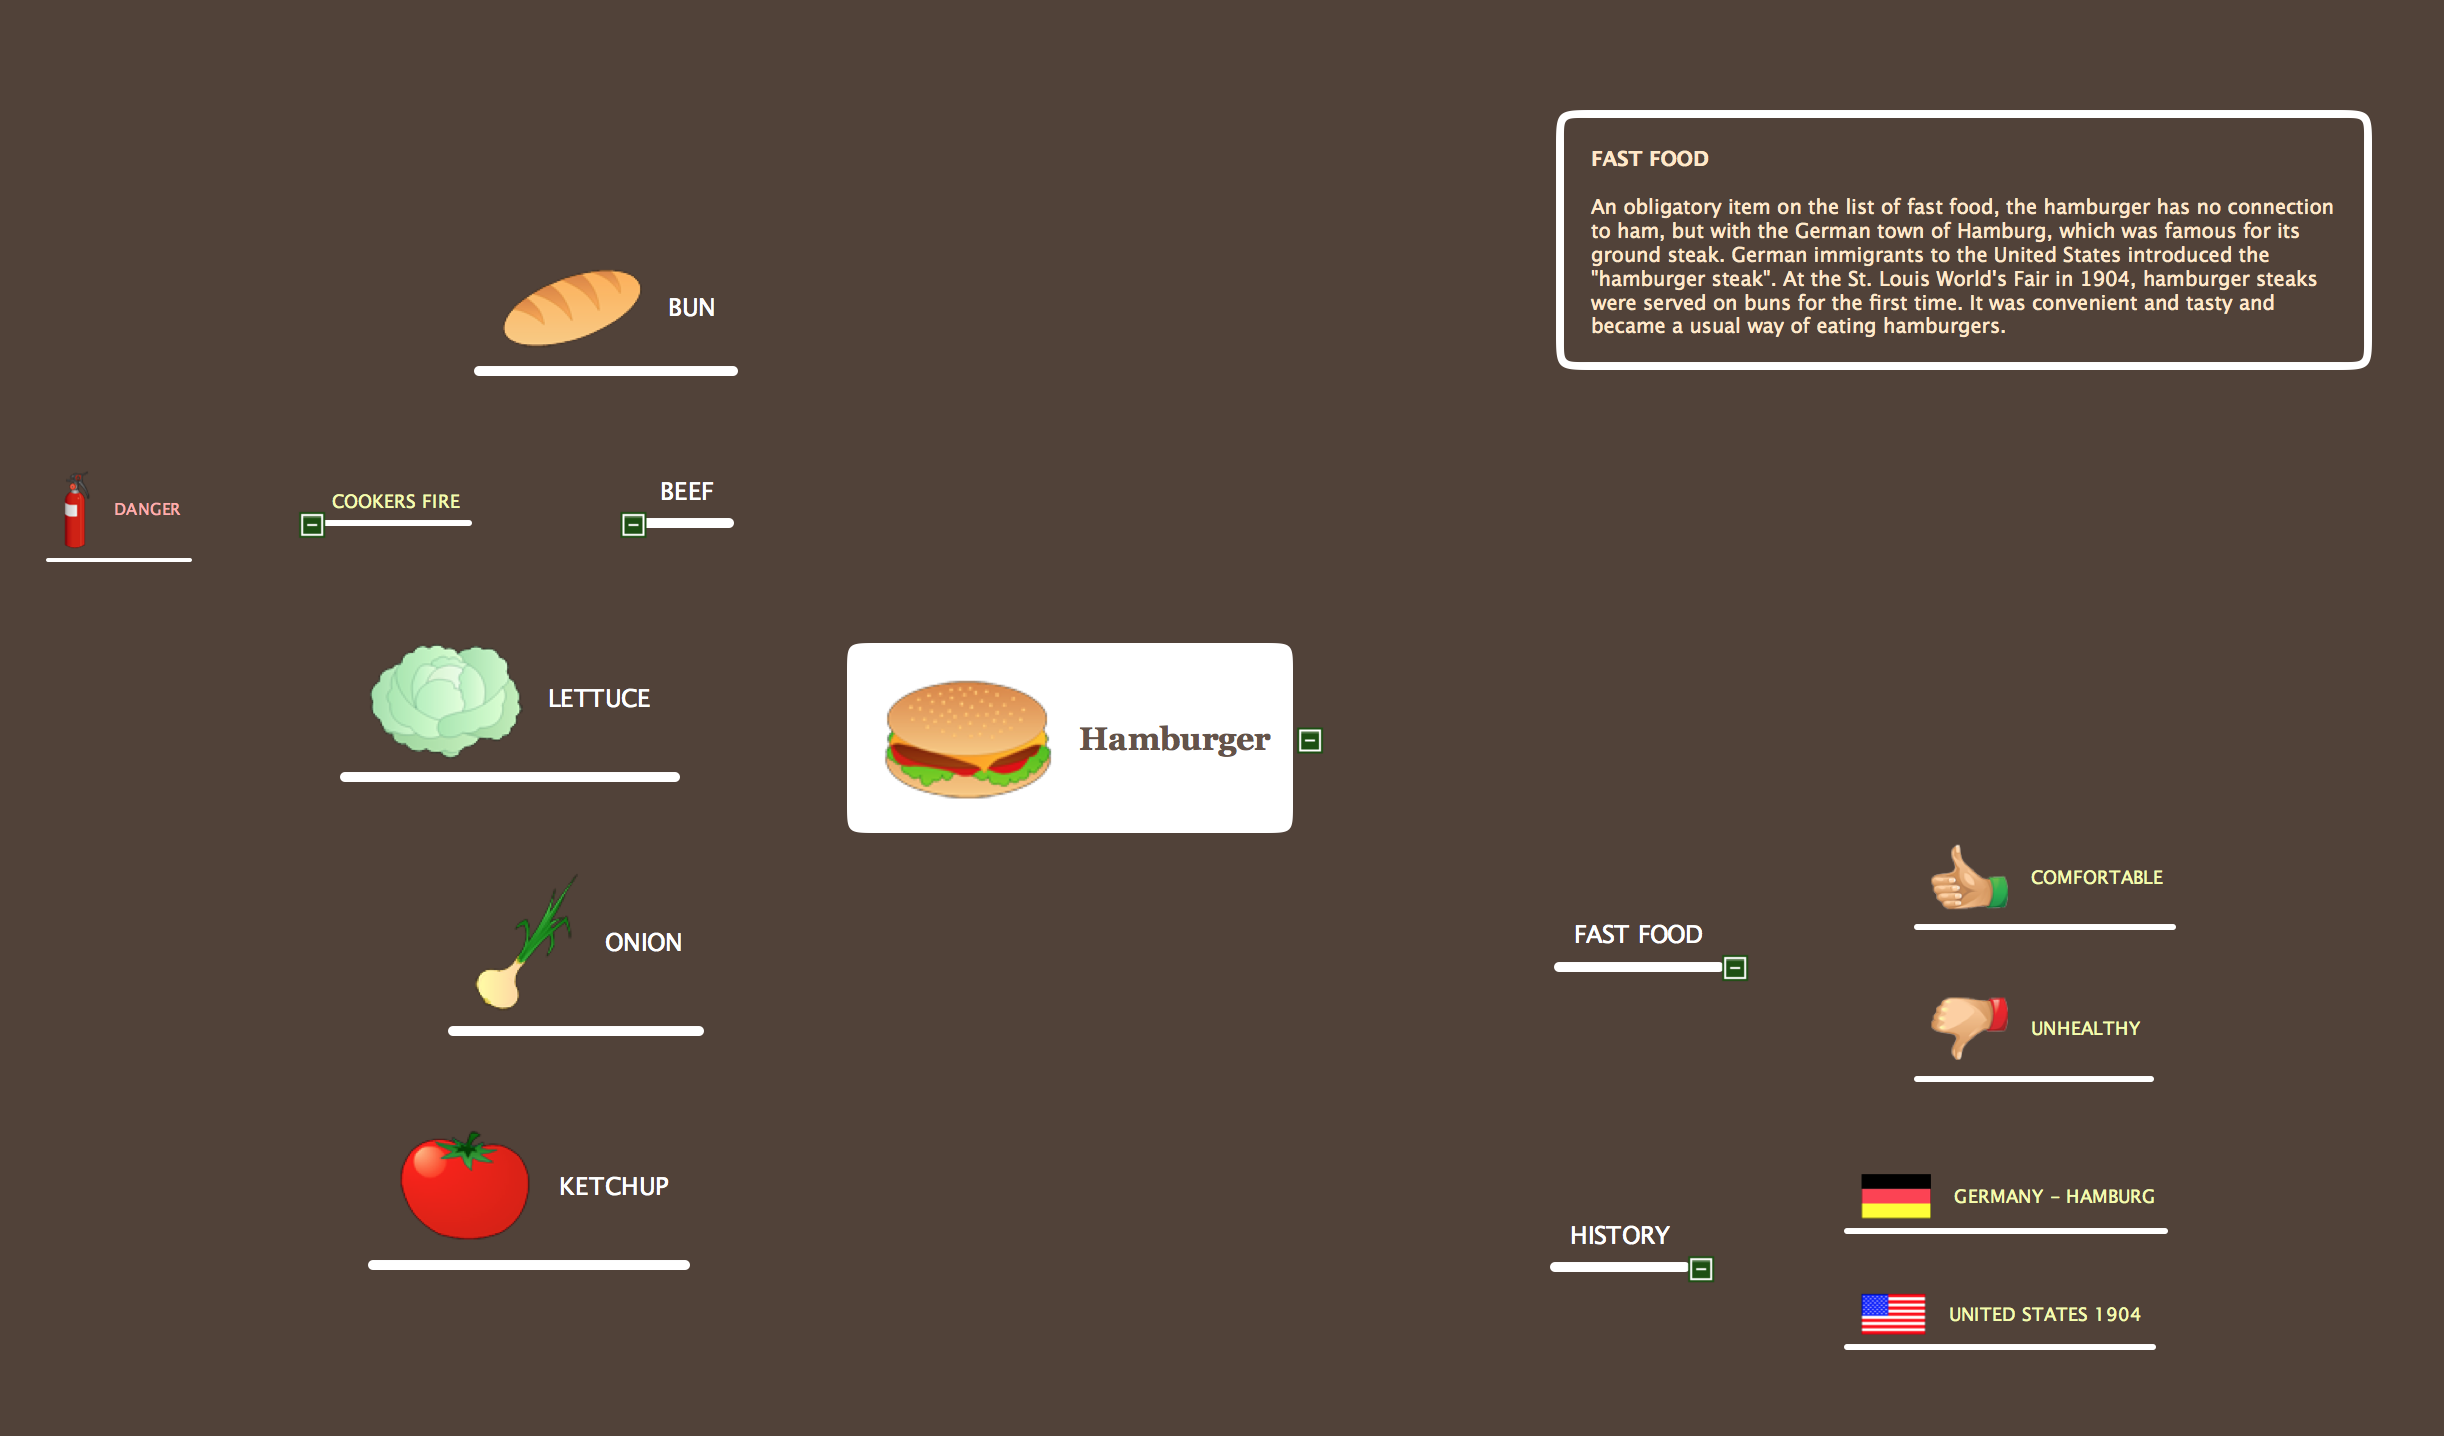
Picture: Mind Map Food
Related Solution:
A competent delegation of responsibilities between workers guarantees business success in most cases. At first sight, it might seem that workflow diagram symbols are quite similar to a regular flowchart. But workflow diagram is a more accurate way to present working processes.
Workflow diagrams are helpful for a working process analyzation, to depict a pathway of process issues, personalize responsibilities and identify resources that will help to optimize a workflow. Generally, Workflow diagram deploys flowchart symbols for displaying work process steps and relationships. But, often it require some additions and improvements to become more professional and illustrative. The Workflow solution for ConceptDraw DIAGRAM provides the user with a big library of symbols that are designed especially for workflow diagrams.
Picture: Workflow Diagram Symbols
Related Solution:
How to draw Metro Map style infographics of New York subway.
New York Subway has a long history starting on October 27, 1904. Since the opening many agencies have provided schemes of the subway system. At present time are 34 lines in use. This page present New York City subway map construct with Metro Map Solution in Conceptdraw DIAGRAM software. This is a one-click tool to add stations to the map. It lets you control the direction in which you create new stations, change lengths, and add text labels and icons. It contains Lines, Stations, and Landmarks objects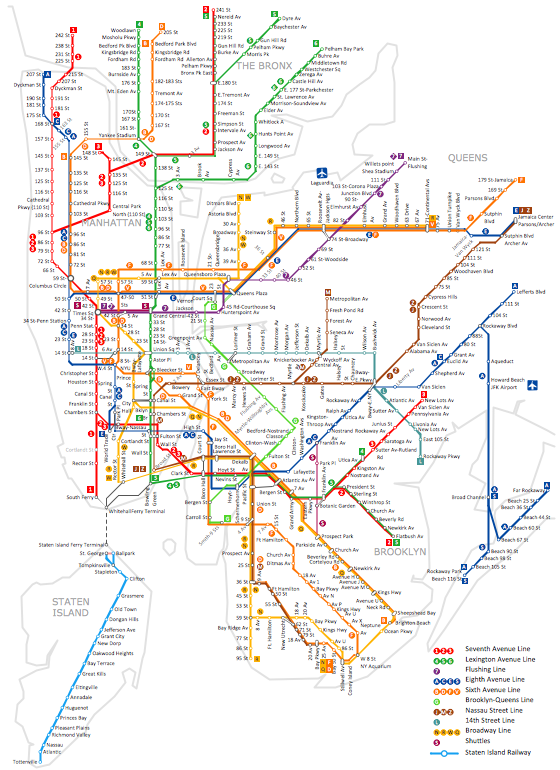
Picture: How to draw Metro Map style infographics? (New York)
Related Solution:
Kansas is a U.S. state located in the Midwestern United States.
The vector stencils library Kansas contains contours for ConceptDraw DIAGRAM diagramming and vector drawing software. This library is contained in the Continent Maps solution from Maps area of ConceptDraw Solution Park.
Picture: Geo Map — USA — Kansas
Related Solution:
ConceptDraw DIAGRAM software enhanced with Metro Map Solution from the Maps Area of ConceptDraw Solution Park provides extensive drawing tools for fast and easy creating various metro maps, route maps, transport schemes, metro path maps, subway train maps, and many other types of maps.
Picture: Metro Maps
Related Solution:
The AWS Architecture Diagrams solution includes icons, sample and templates for several Amazon Web Services products and resources, to be used when creating architecture diagrams. The icons are designed to be simple so that you can easily incorporate them in your diagrams and put them in your whitepapers, presentations, datasheets, posters or any technical material you like.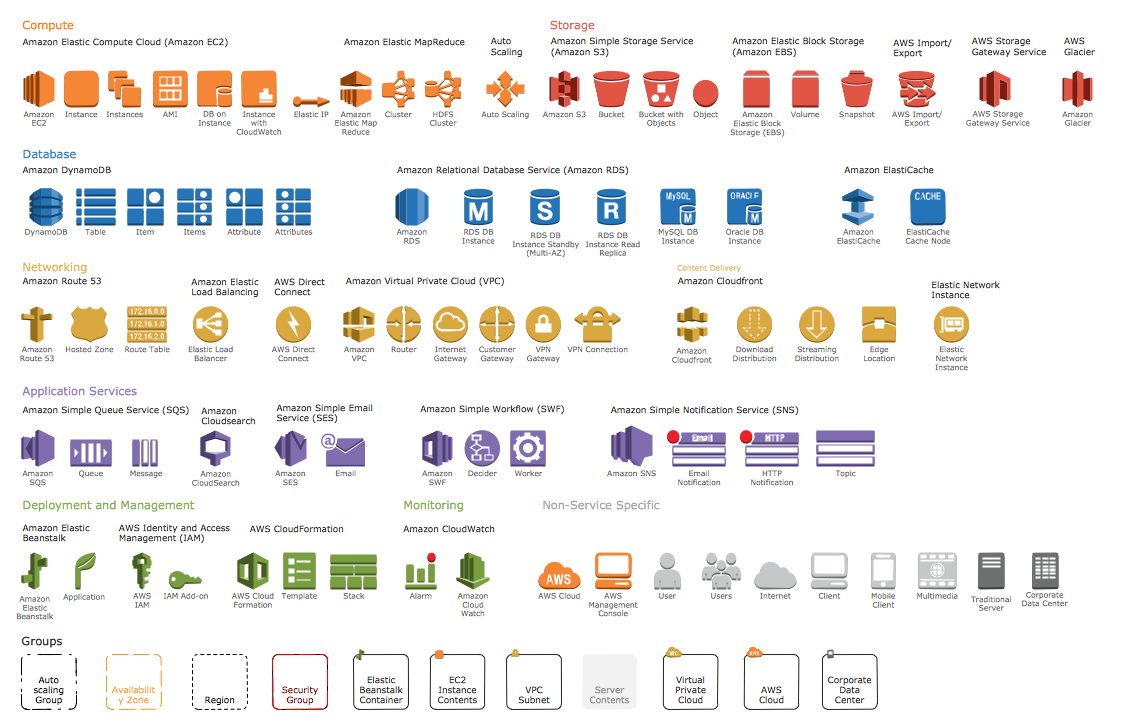
Picture: AWS Simple Icons for Architecture Diagrams
Sales process management is a business discipline which focuses on the development and practical application of various sales techniques, and on the management of sales operations of the company.
It is effective to use professional software for the sales process management. ConceptDraw DIAGRAM diagramming and vector drawing software extended with Sales Flowcharts solution from the Marketing area of ConceptDraw Solution Park is the best choice.

Picture: Sales Process Management
Related Solution:
You need design Electrical Schematic and dream to find the useful tools to draw it quick and easy? ConceptDraw DIAGRAM offers the unique Electrical Engineering Solution from the Industrial Engineering Area which will effectively help you!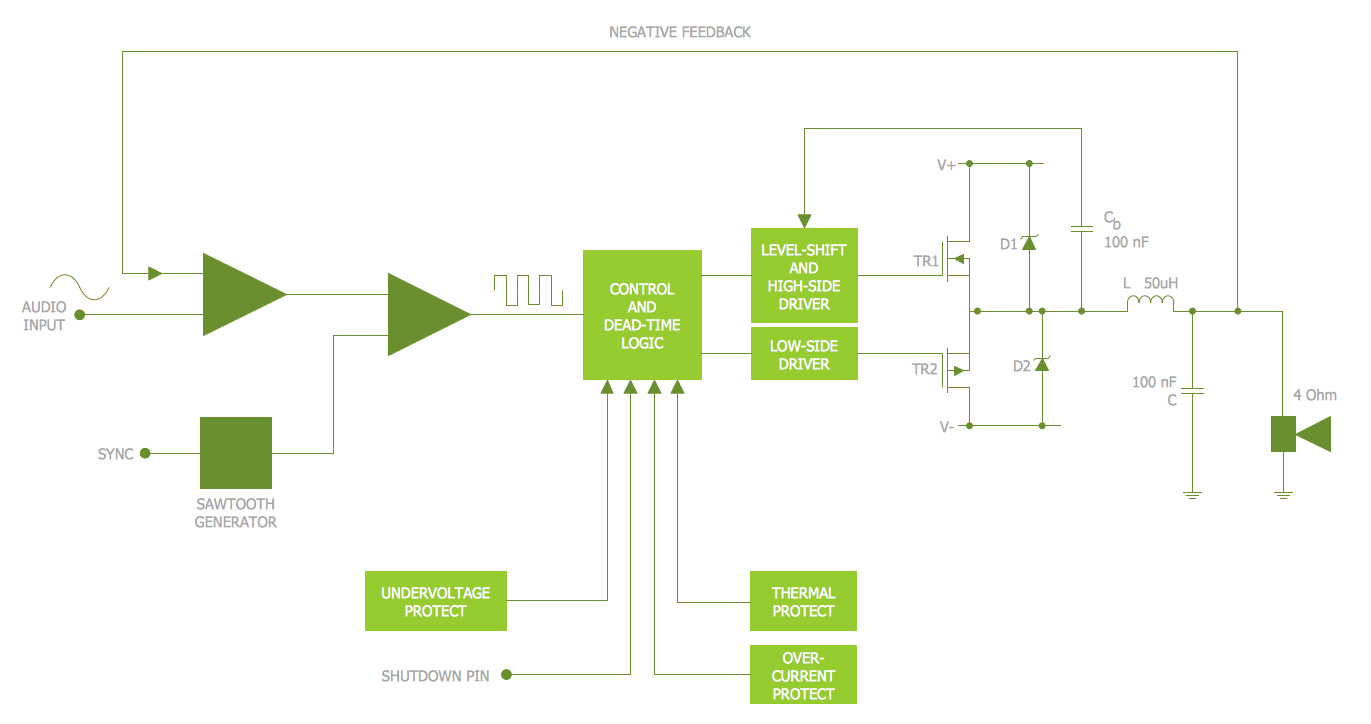
Picture: Electrical Schematic
Related Solution:
Local area network connects computers and other network appliances within an area, such as office building or a campus. It can be difficult to provide such network without a predesigned plan. For these purposes you can use network diagram software, which helps you to create LAN network diagrams and office network diagrams quickly and effortless. This will speed up your work and you can save the diagram for the future network improvements.
The following diagram illustrates a network topology of the small office. LAN configuration has a star topology. The local network joins 8 computers among which are several desktop PCs, laptop, two iMacs and iBook. The end-point devices are divided into three groups. Each group is connected to its hub. There is a network printer and a modem, which are interconnected with other devices through a network server. Each computer on the LAN can access the server through a corresponding hub.
Picture: Network Diagram Software. LAN Network Diagrams. Physical Office Network Diagrams
Related Solution:


