
Sample 1. Gold Medals in 2010 Winter Olympics
The Winter Sports solution from Sport Area of ConceptDraw Solution Park contains winter sports illustrations and diagram examples, templates, and vector sport pictogram libraries.
This example was created in ConceptDraw DIAGRAM using the 'Winter Sports Symbols' library, from our Winter Sports Solution. An experienced user spent 15 minutes creating this sample.
Whoever you are, sports fan, blogger, or journalist, you may be interested in tracking Olympic results. This is a good example of an illustrated table you may easily modify, print, or publish on web.
TEN RELATED HOW TO's:
In software engineering, it is important to understand how the system would cooperate with external sources, like data sources. To give this information a visual representation, data flow diagrams (DFD) were used for years. The entire system is usually divided into smaller ones, and all of them process data flows in appropriate ways.
The visualizing business processes which engages the data transfer, is commonly preformed using DFDs (data flow diagrams). DFD is used to show the data flow processing and transformation. This DFD represents the electronic system of a customer purchase. It was created using Gane/Sarson notation. Data flow diagrams helps you to sort through and clarify transferring process making it available for analysis, and representation. ConceptDraw DFD solution introduces the vector library, containing the full set of icons from DFD notations.
Picture: Data Flow Diagram (DFD)
Related Solution:
Business and Finance solution from Illustration area of ConceptDraw Solution Park - use it to quick draw illustrations, diagrams and infographics for your advertising and marketing documents, presentations and websites.
The vector clipart library Advertising includes 8 concept images.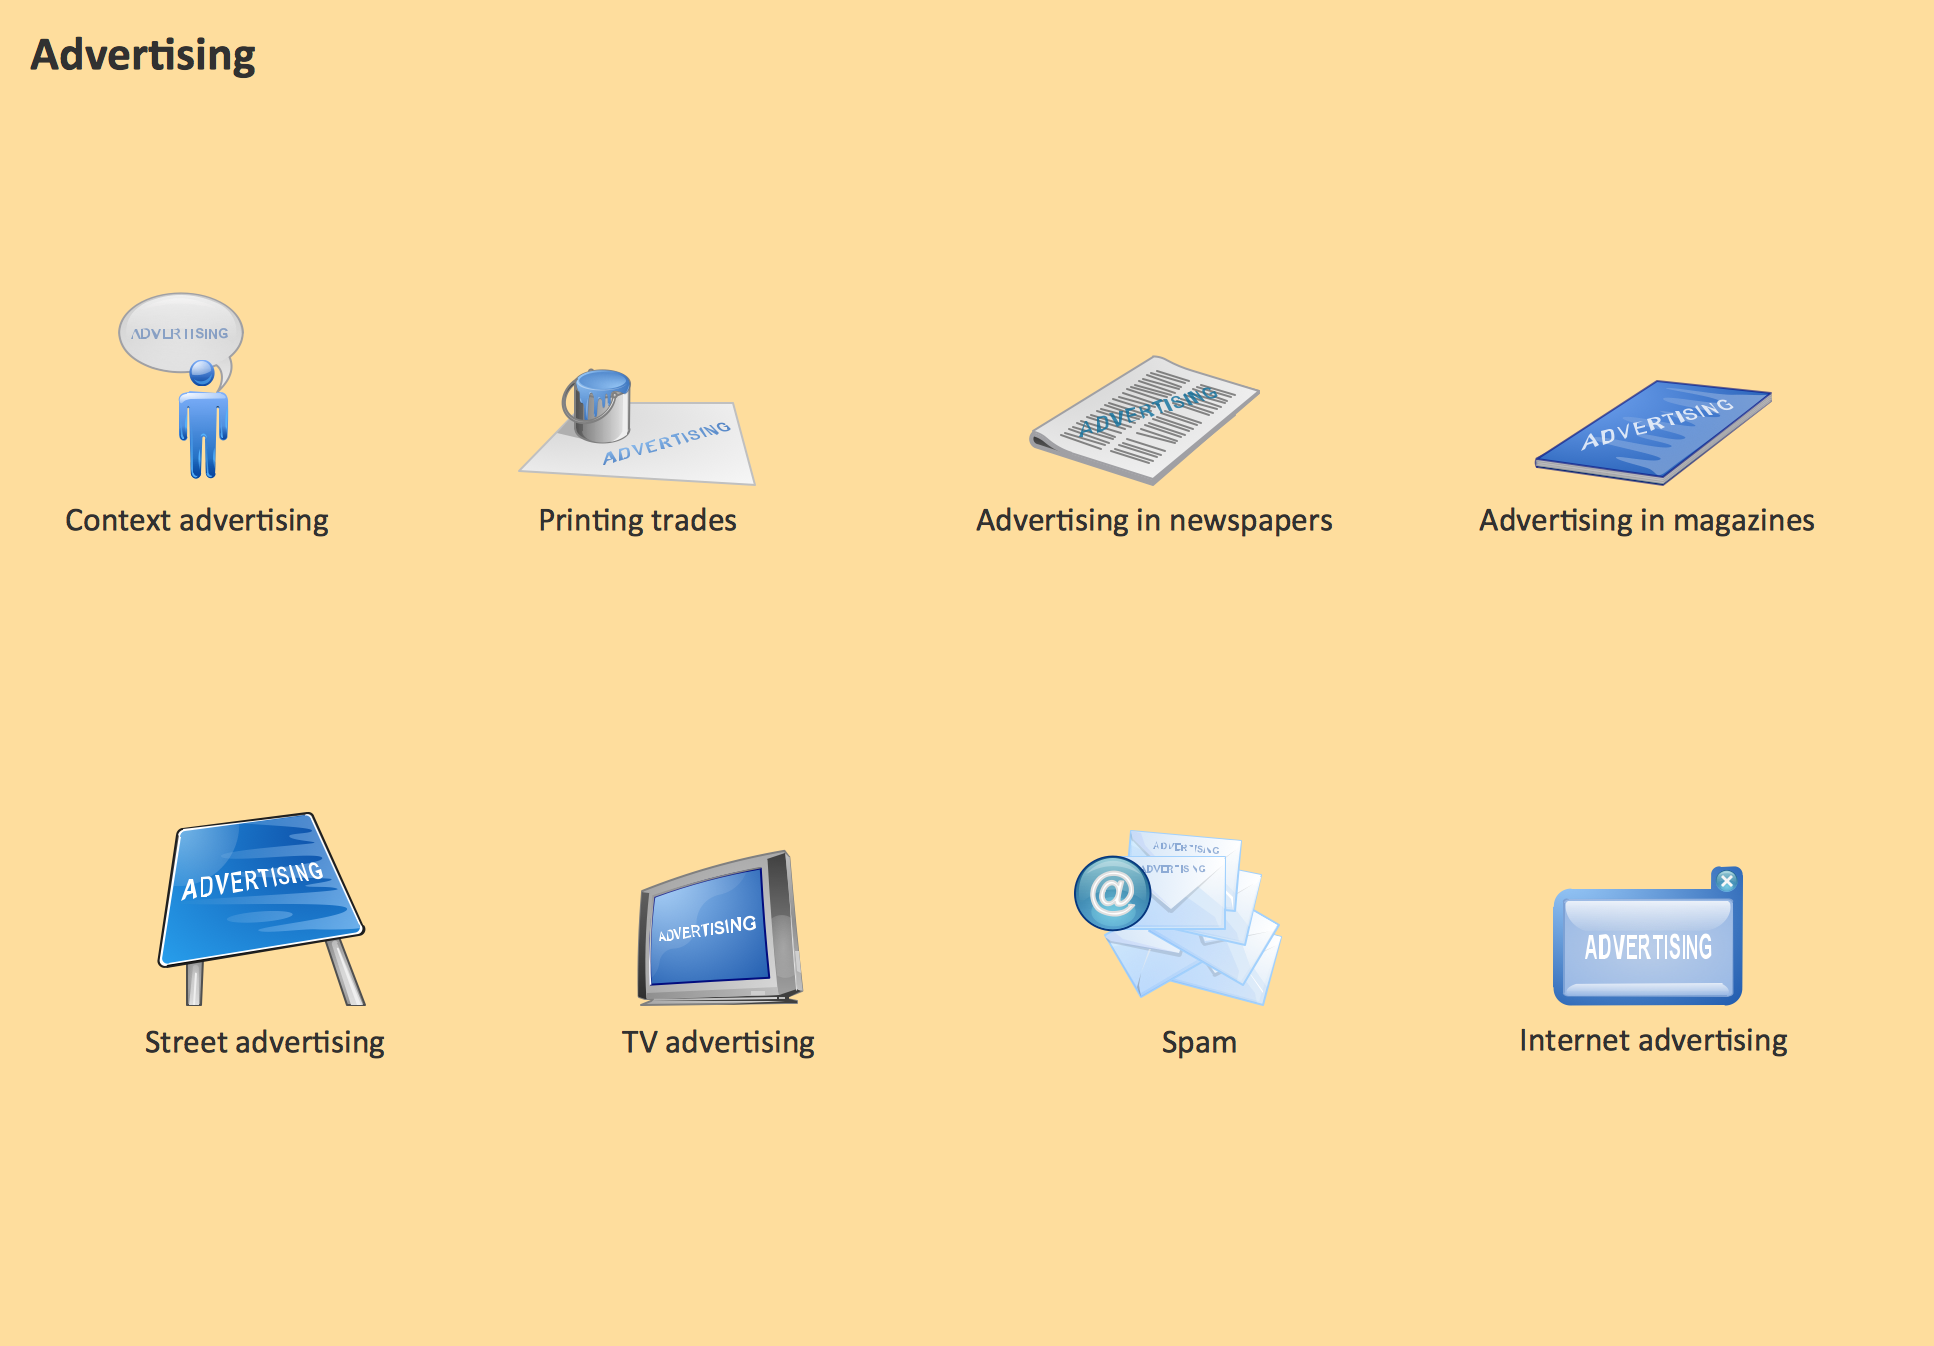
Picture: Advertising - Design Elements
Related Solution:
Use it to make professional looking documents, presentations, and websites illustrated with color scalable vector clipart for geography, weather, and animals.
Picture: Clipart School Example
Related Solution:
The vector stencils library Watercraft contains clipart of ships, boats, yachts, submarines for ConceptDraw DIAGRAM diagramming and vector drawing software.
Use it to draw illustrations of vessels and water transport over a sea, ocean, lake, canal, river.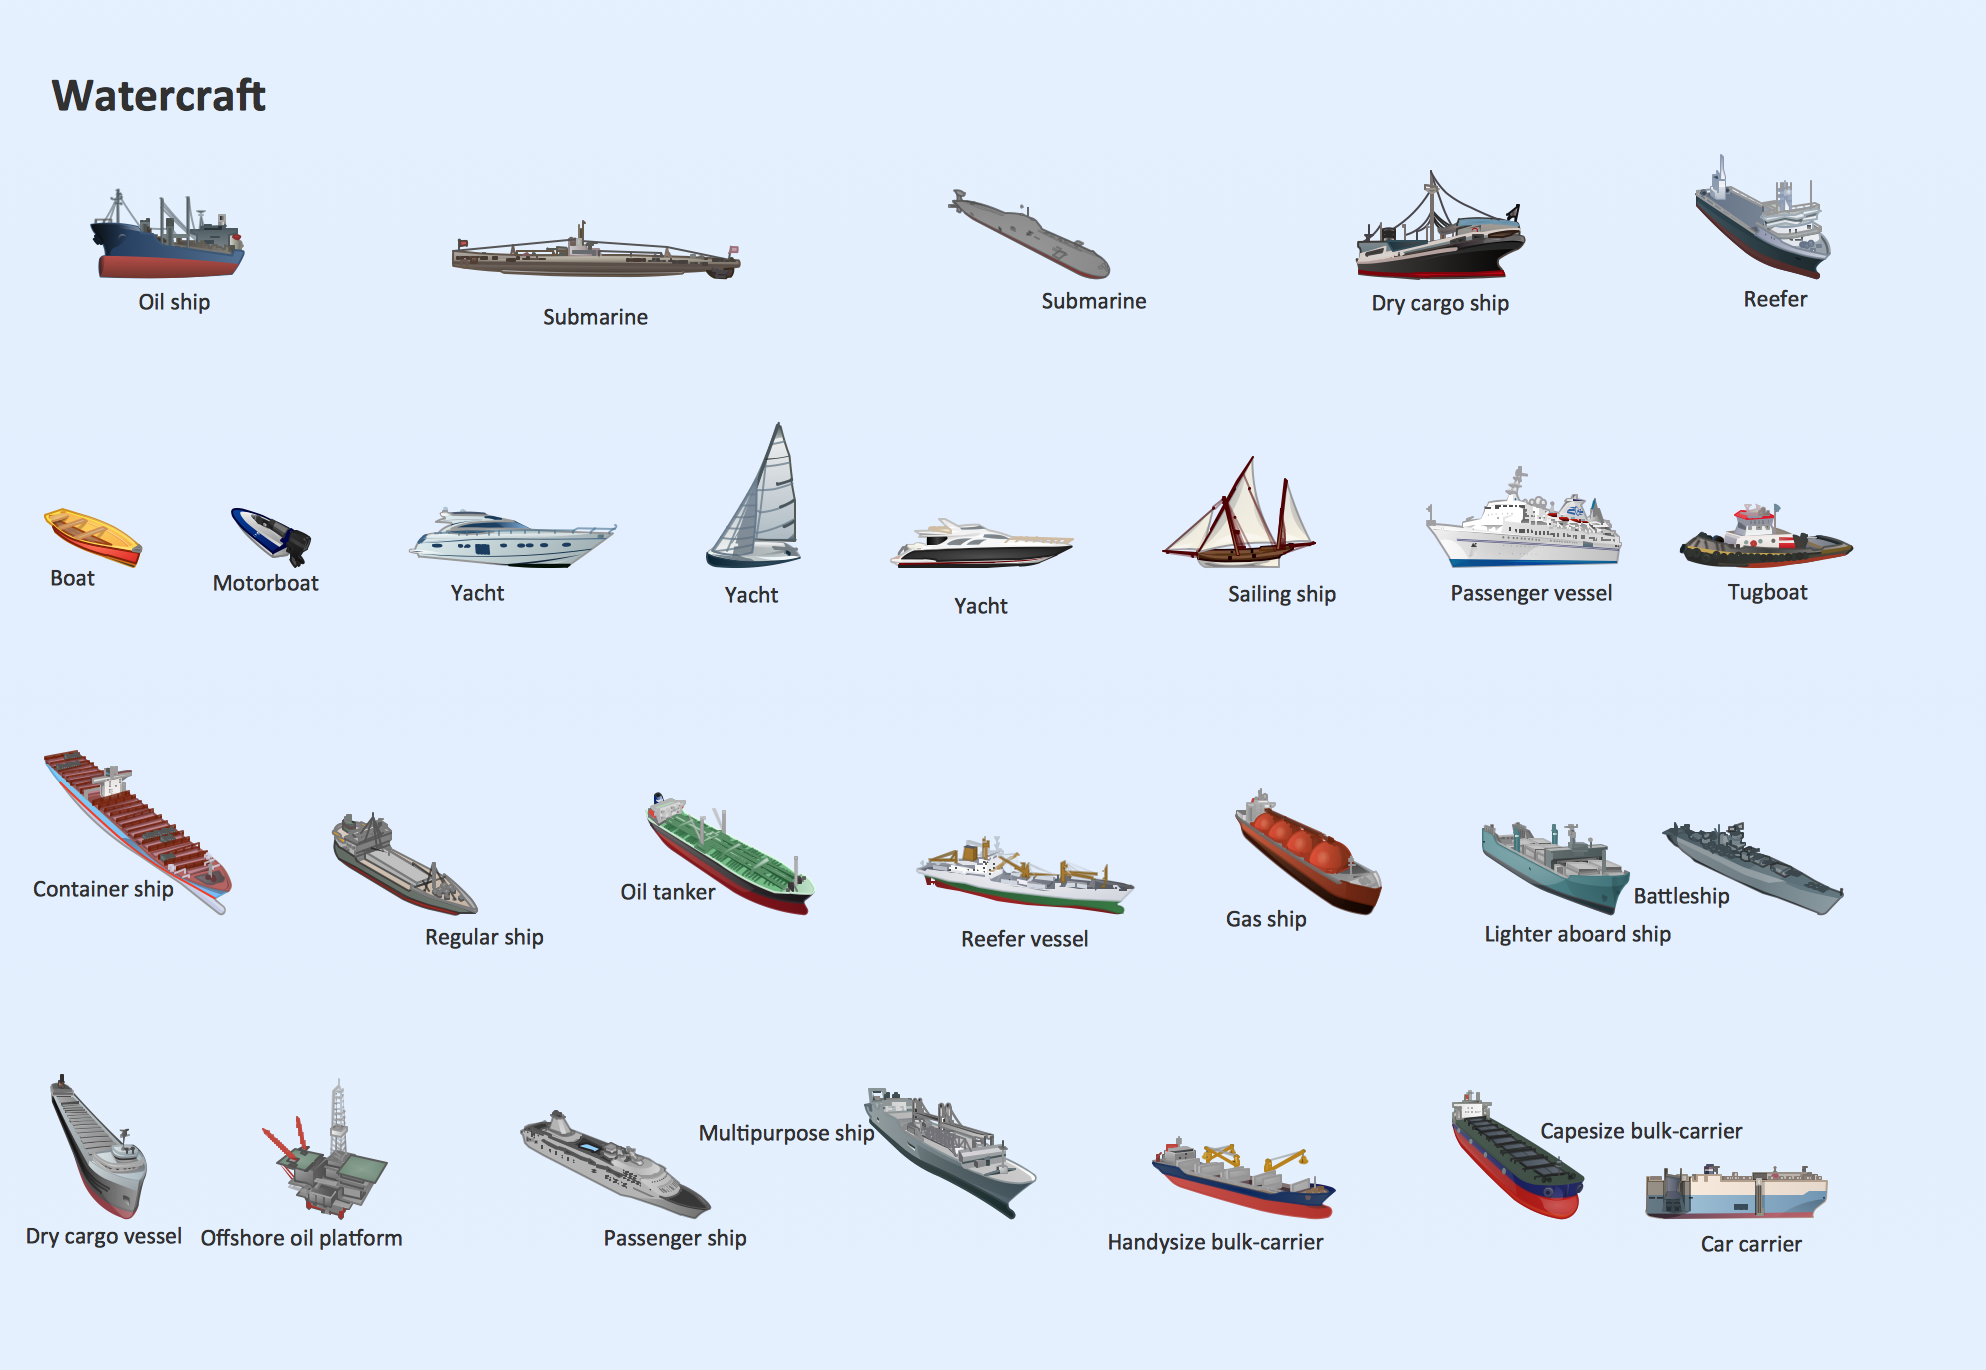
Picture: Watercraft - Design Elements
Related Solution:
Interactive tool helps you find the appropriate response to social media mentions quickly.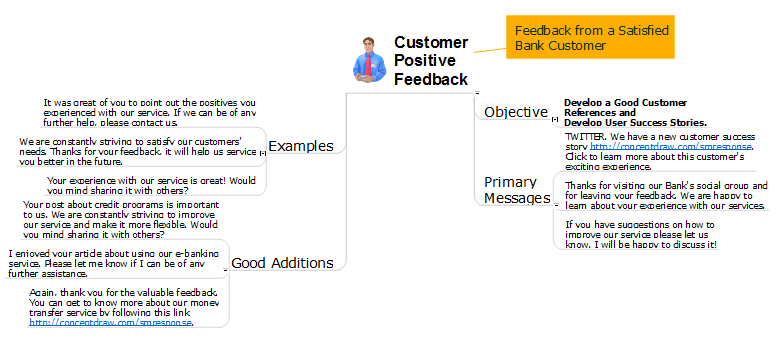
Picture: How to Prepare Learning Presentations for Training
Related Solutions:
All about prototyping. GUI Prototyping with ConceptDraw. Download prototyping software.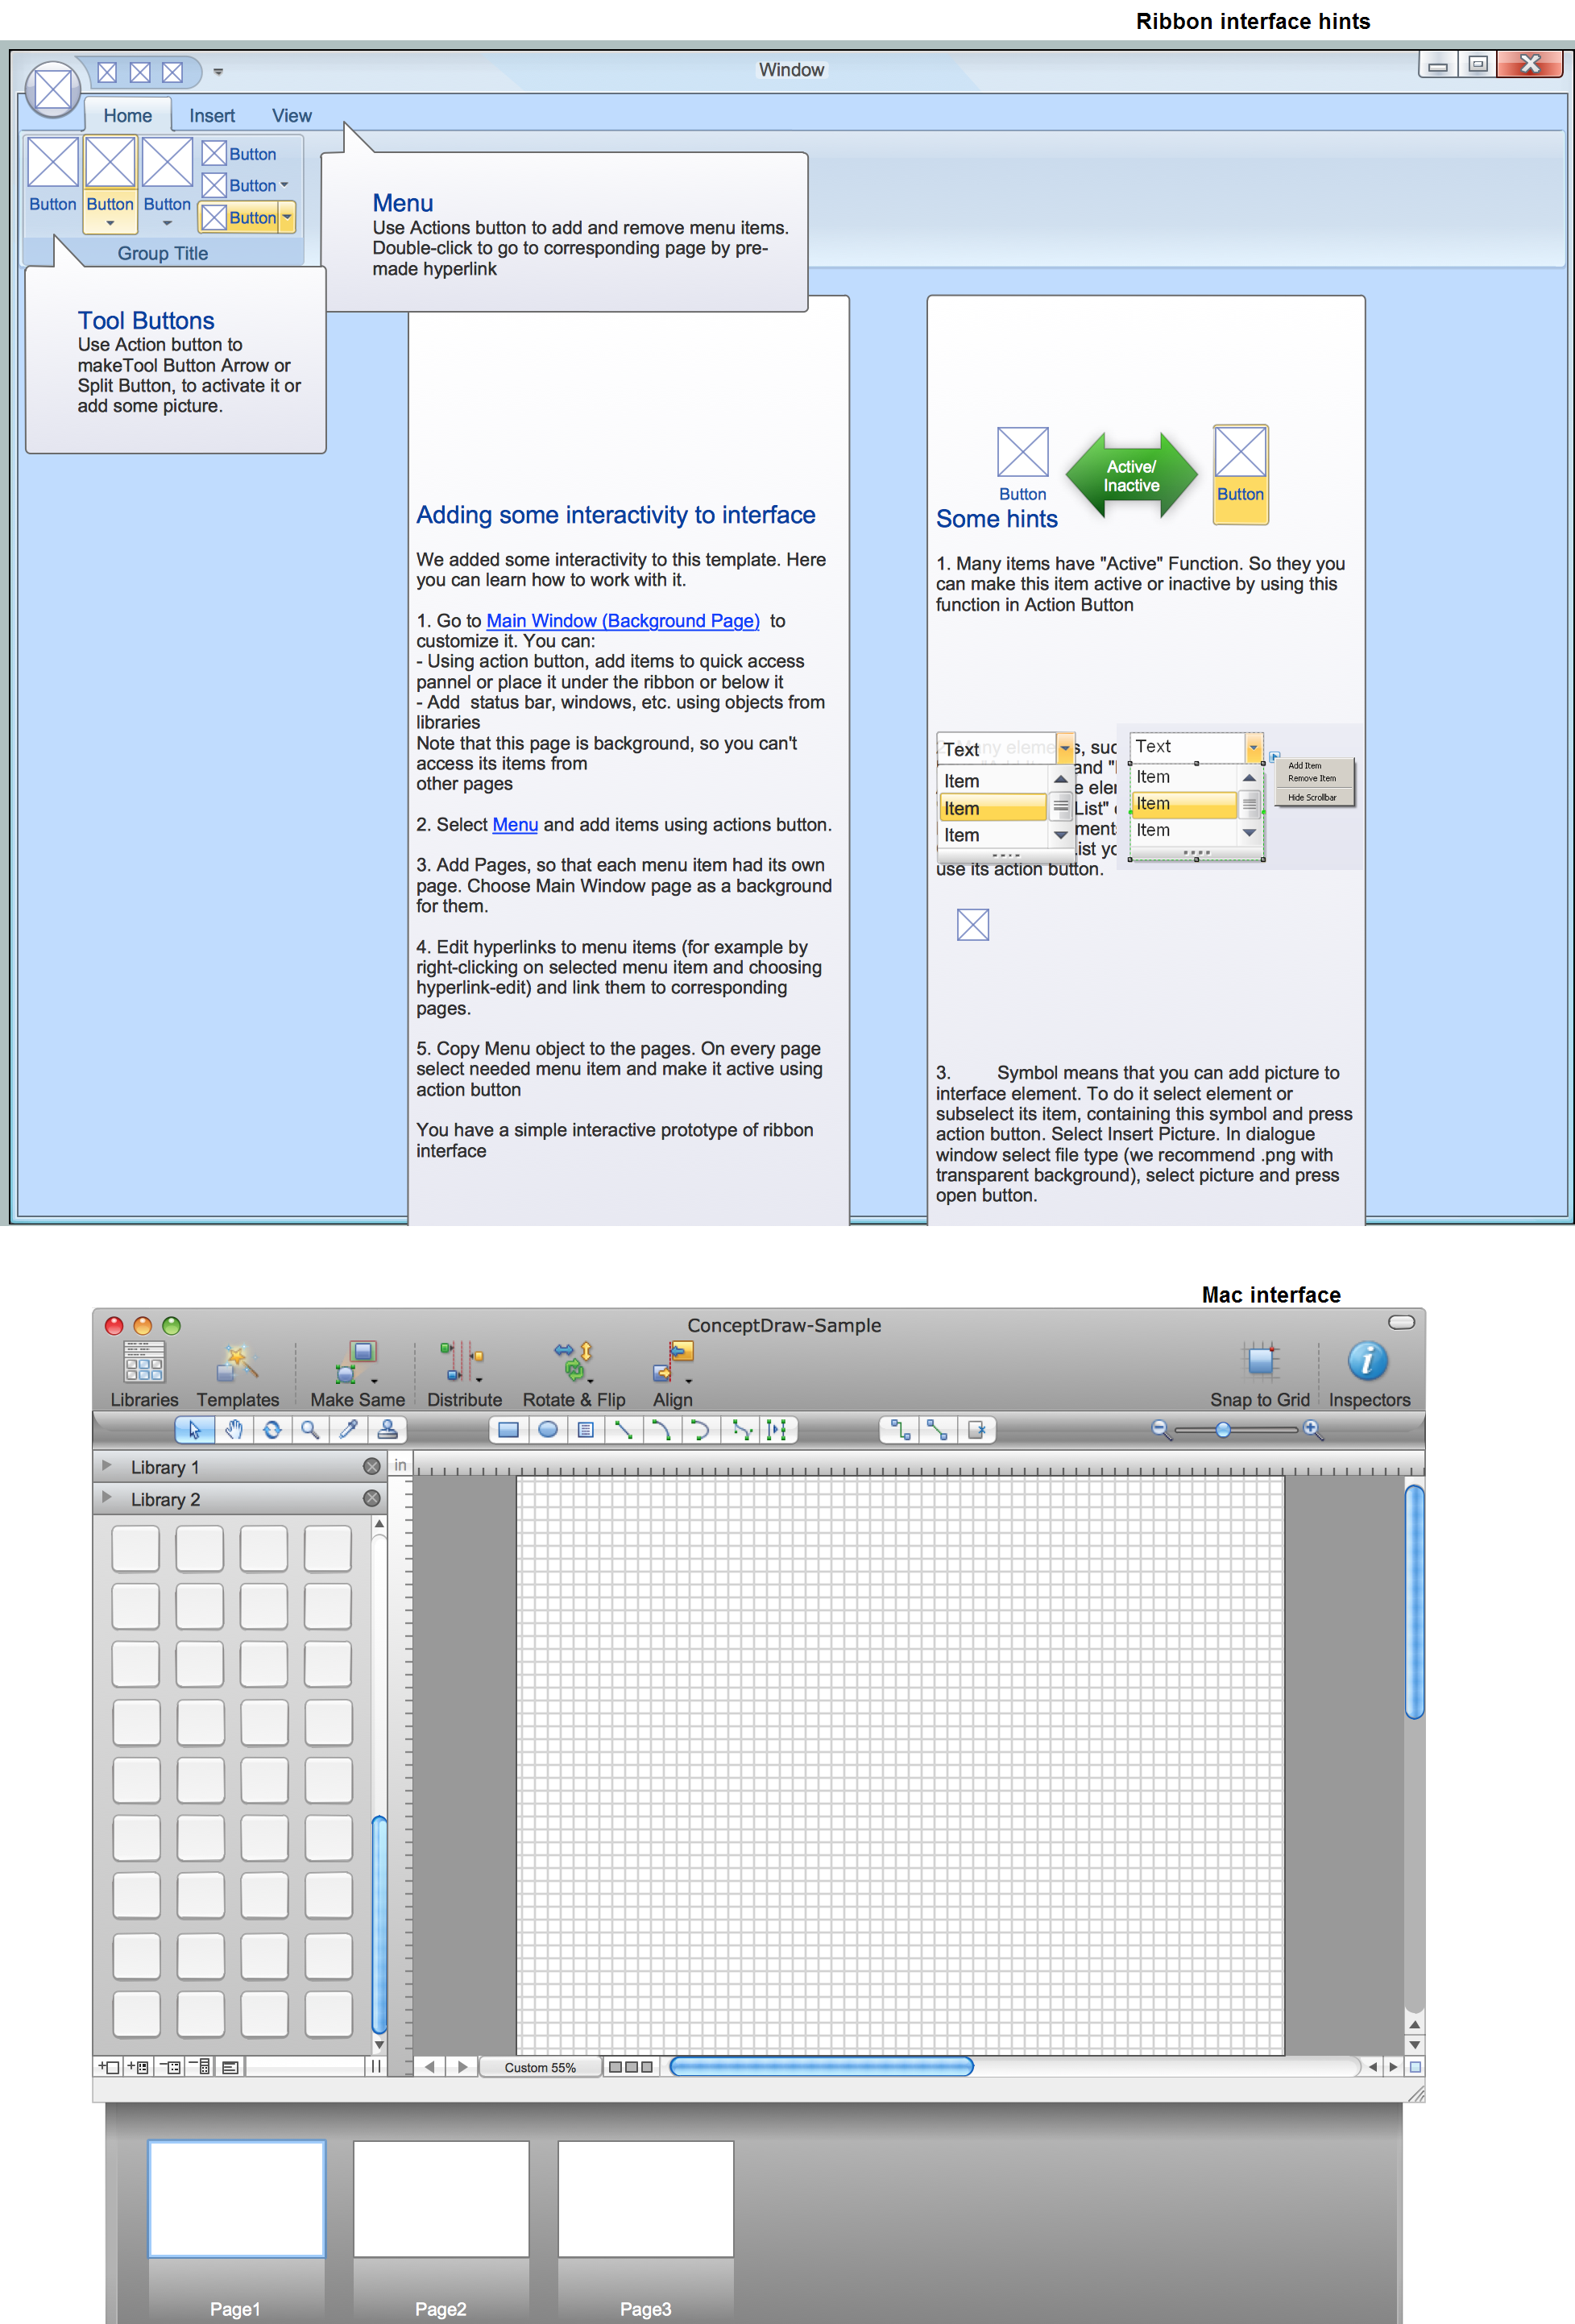
Picture: GUI Prototyping with ConceptDraw DIAGRAM
You want design Typography Graphic and need powerful infographic software? Then ConceptDraw DIAGRAM is exactly what you need.
Picture: Typography Graphic
Related Solution:
Nature solution expands ConceptDraw DIAGRAM software with samples, templates and libraries of vector clip art for drawing of Nature illustrations.
Use Geography library of vector stencils to draw natural landscapes.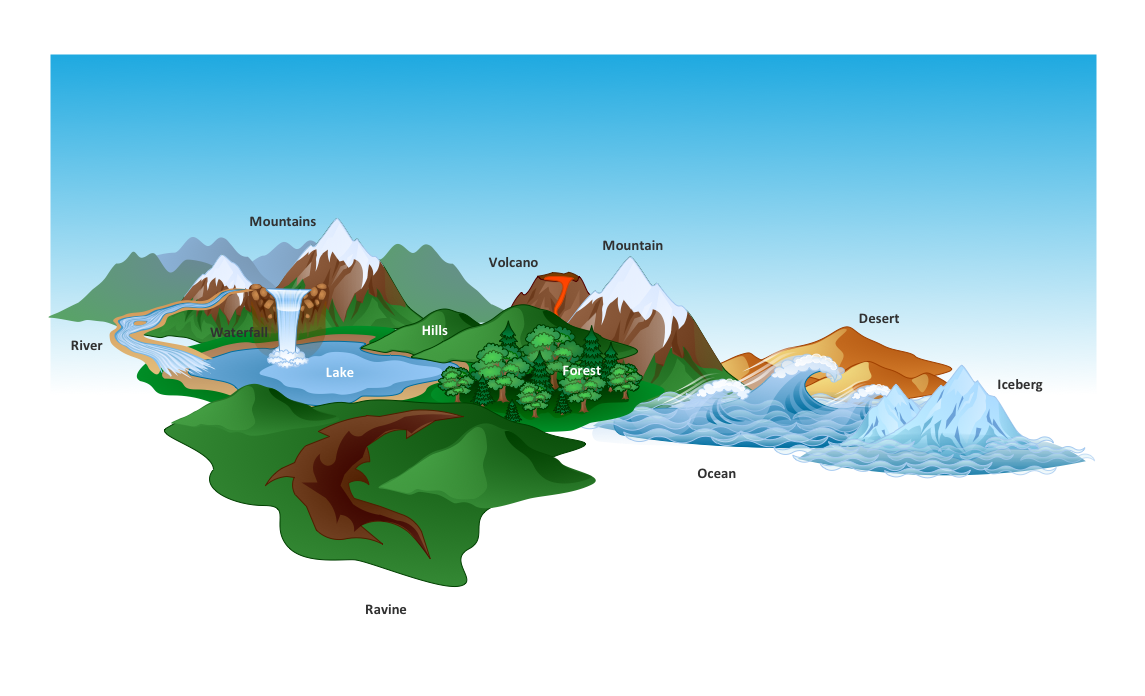
Picture: How to Draw a Natural Landscape
A process flowchart is a picture of the separate steps of a process in sequential order.Use ConceptDraw DIAGRAM software and the vector stencils from object libraries are designed objects you can use adding to process flowcharts for the best result.
Picture: Create Process Flowcharts
Related Solution:
ConceptDraw DIAGRAM drawing software offers the best infographic tools - Data-driven Infographics Solution.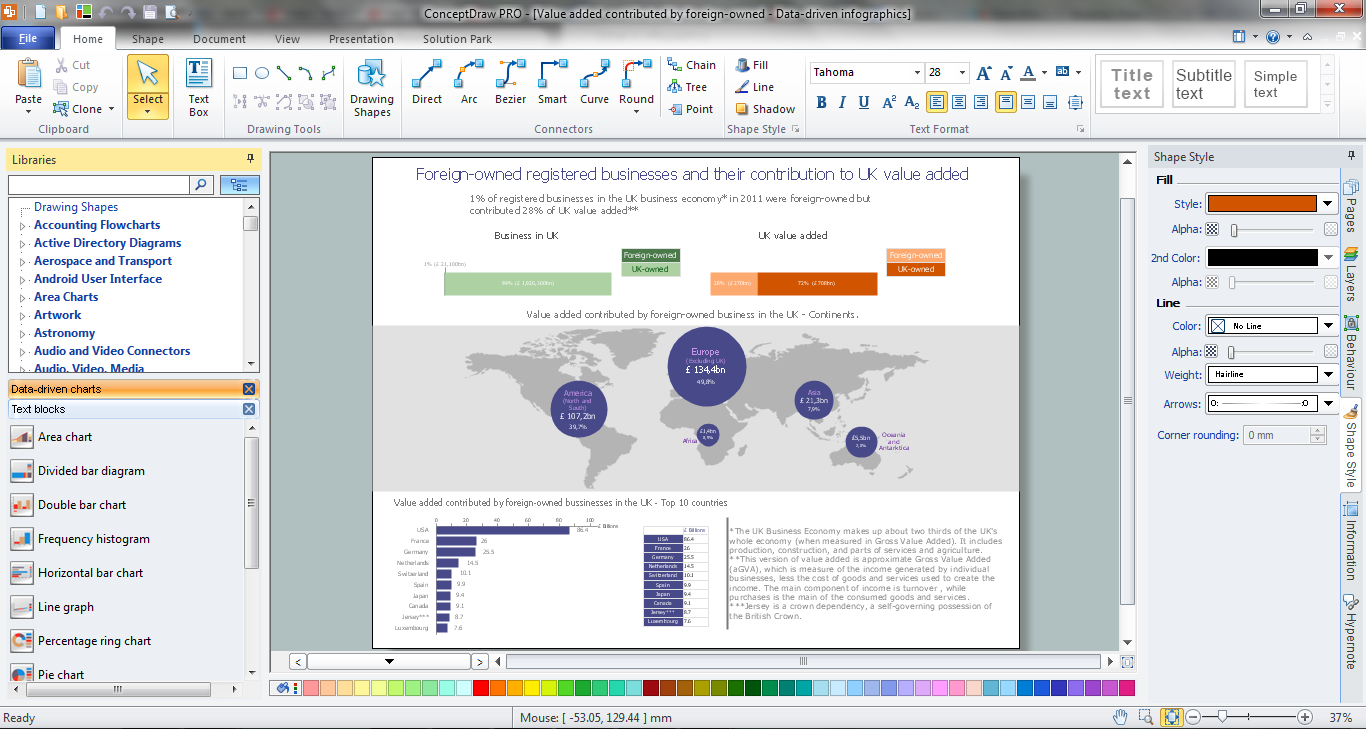
Picture: Infographic Tools
Related Solution: