
Pic. 1. ConceptDraw PROJECT - Gantt chart view.
The left pane of the Gantt Chart contains a list of tasks and shows their dates, priority, assigned resources, and subtasks. Markers help you identify the different types of task.

Pic. 2. Table part of a Gantt chart.
The right pane of the Gantt Chart shows a timeline of your project. Colored bars cover the dates assigned to each task, and changes of color within those bars show the task’s degree of completion.

Pic. 3. Gantt chart timeline.
The purpose of ConceptDraw PROJECT is to track who does what, when, as well as reporting on the cost of your project over time. It will help you manage your time better by tracking the tasks your project consists of, when they will be executed, who is assigned to each task, and the associated costs.
Learn more about creating a Gantt chart in ConceptDraw PROJECT
TEN RELATED HOW TO's:
The Cause and Effect diagram introduced by Kaoru Ishikawa in 1968 is a method for analyzing process dispersion. It can help you to dive into a problem and find an effective solution, identify and represent the possible causes for an effect, analyze the complex business problems and successfully solve them.
You can design your Cause and Effect diagram on a paper, but more effective way is to use specific software - ConceptDraw DIAGRAM is a powerful Cause and Effect Diagram Software. It helps you create Cause and Effect diagram known also as Fishbone diagram or Ishikawa diagram from templates and examples.
Picture: Cause and Effect Diagram Software
Related Solution:
ConceptDraw DIAGRAM is a powerful intelligent vector graphics engine that can be used to create basic diagrams including flowcharts, charts, workflows, flowcharts, organizational charts, business diagram, learn business diagrams, flow diagrams.
Picture: The Best Mac Software for Diagramming or Drawing
Related Solution:
This sample was created in ConceptDraw DIAGRAM diagramming and vector drawing software using the Organizational Charts Solution from the Software Development area of ConceptDraw Solution Park.
This sample shows the organizational chart in the field of Architect Engineering. Create your own orgchart professional drawings using ConceptDraw.
Picture: Business Board Org Chart
Related Solution:
Below you can see the symbol for pool table. You can find this symbol in the library of the Floor Plans Solution and use it in your floor plan of the sport complex, home, etc.
ConceptDraw DIAGRAM is a powerful diagramming and vector drawing software for creating the different Floor Plans. It’s very convenient, simple and quick to design the professional looking Floor Plans of any difficulty in ConceptDraw DIAGRAM.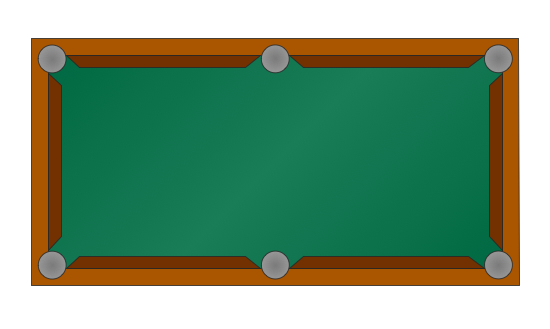
Picture: Symbol for Pool Table for Floor Plans
Related Solution:
The best way to visualize the introduction to Cloud computing architecture is to create diagrams and schematics representing what is a cloud computing and how it works. For their design, we recommend to use a powerful ConceptDraw DIAGRAM diagramming and vector drawing software supplied with Cloud Computing Diagrams solution from the Computers and Network area of ConceptDraw Solution Park
Picture: Introduction to Cloud Computing Architecture
Related Solution:
Use ConceptDraw DIAGRAM business diagramming and business graphics software for general diagramming purposes, it inludes tousands colored professional flowchart symbols, examples and samples which saves time when you prepare documents, professional presentations or make an explanation of process flow diagram.
Picture: Flow Chart Design — How to Design a Good Flowchart
Related Solution:
Everyone who starts the construction, repair or remodeling of the home, flat or office, is facing with a need of visualization its ideas for visual explanation how all should to be for the foreman and construction team. It is incredibly convenient to use for this professional home architect software. ConceptDraw DIAGRAM software enhanced with Floor Plans solution provides a lot of built-in drawing tools which allow you quick and easy create design plans for the home of your dreams.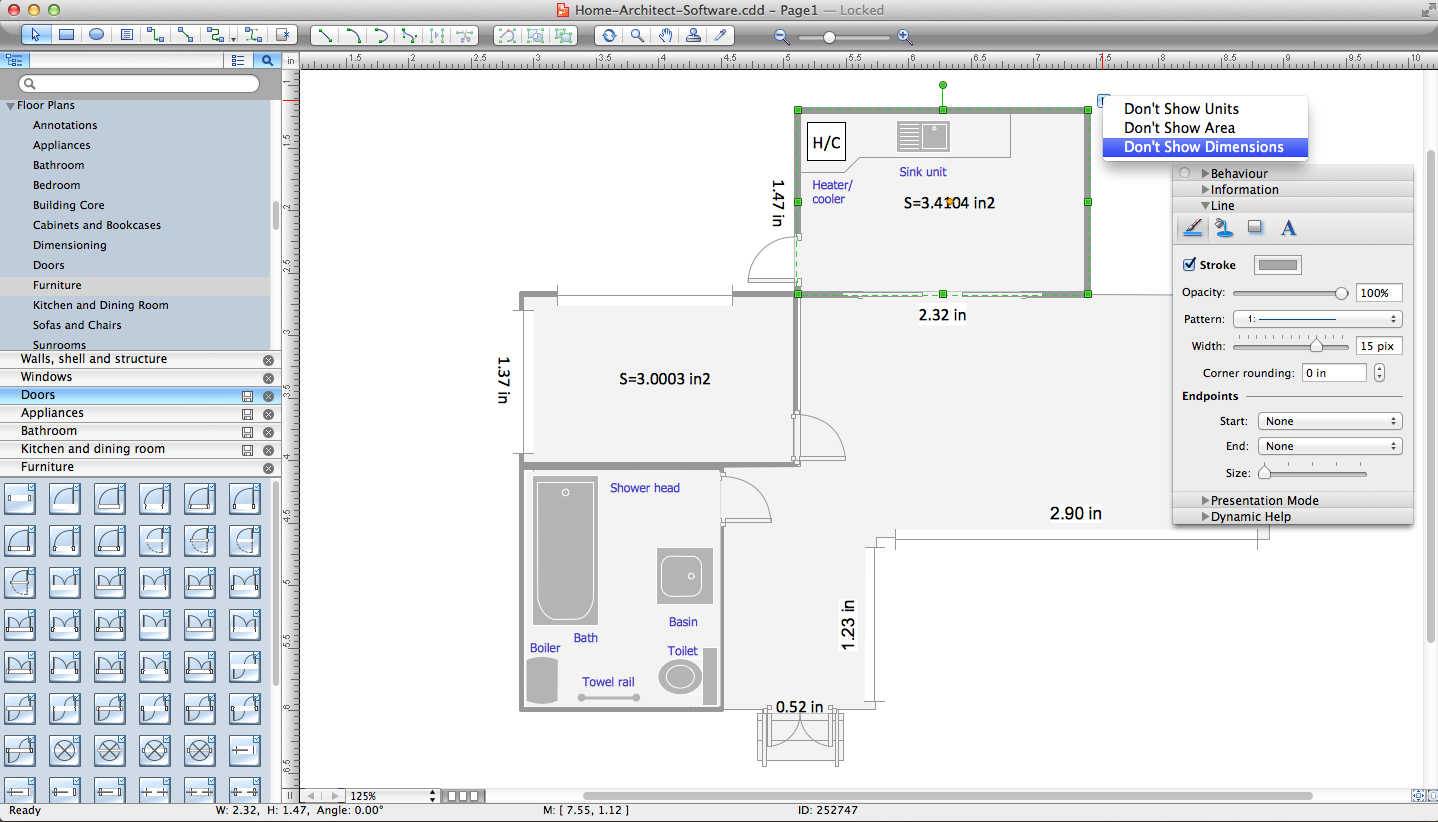
Picture: Home Architect Software. Home Plan Examples
Related Solution:
UML state machine's goal is to overcome the main limitations of traditional finite-state machines while retaining their main benefits.
ConceptDraw has 393 vector stencils in the 13 libraries that helps you to start using software for designing your own UML Diagrams. You can use the appropriate stencils of UML notation from UML State Machine library.
Picture: UML State Machine Diagram.Design Elements
Related Solution:
The UML diagram is a powerful tool which lets visually represent all system's components, the interactions between them and relationships with external user interface.
The Rapid UML solution for ConceptDraw DIAGRAM software offers diversity of UML flowchart symbols for drawing all types of UML diagrams.
Picture: UML Flowchart Symbols
Related Solution:
ConceptDraw DIAGRAM is a powerful intelligent vector graphics tool for drawing flowcharts.
Picture: Basic Diagramming Flowchart Software
Related Solution: