Made with
ConceptDraw
MINDMAP 16

Presentation in MINDMAP
All in One

When planning to create a neat presentation out of lot of data, try mind mapping.

It is handy, especially when you want to represent pictures and text on the same page.

Let’s take a look at a specific example: Oscars 2015: Nominations List

We start by copying a list of nominees for the 2015 Oscars from an official source and pasting it into a MS Word file. Now we have a template. Let’s prepare it for ConceptDraw MINDMAP import:

  • Set a bigger font for mindmap Main Topic
  • Number Categories, they will be converted as topics
  • Use bulleting to separate nominees, they will be converted as subtopics
  • Save MS Word file

Mindmap Presentation

Run ConceptDraw MINDMAP and import your list of nominees via File menu – Import – MS Word.

Mindmap Presentation

Now we have a mindmap with a standard theme and arrangement. Let’s polish it.

Go to Themes drop-down menu and pick one of various templates for your mindmap.

Mindmap Presentation

It’s up to you when it comes for pictures, you may drag and drop it right to the Topc, Subtopic, or connect as a stand-alone icon.

Also, there are predesigned icons grouped per areas, which you may add to your mindmap presentation using the Clipart panel.

Presentation in MINDMAP

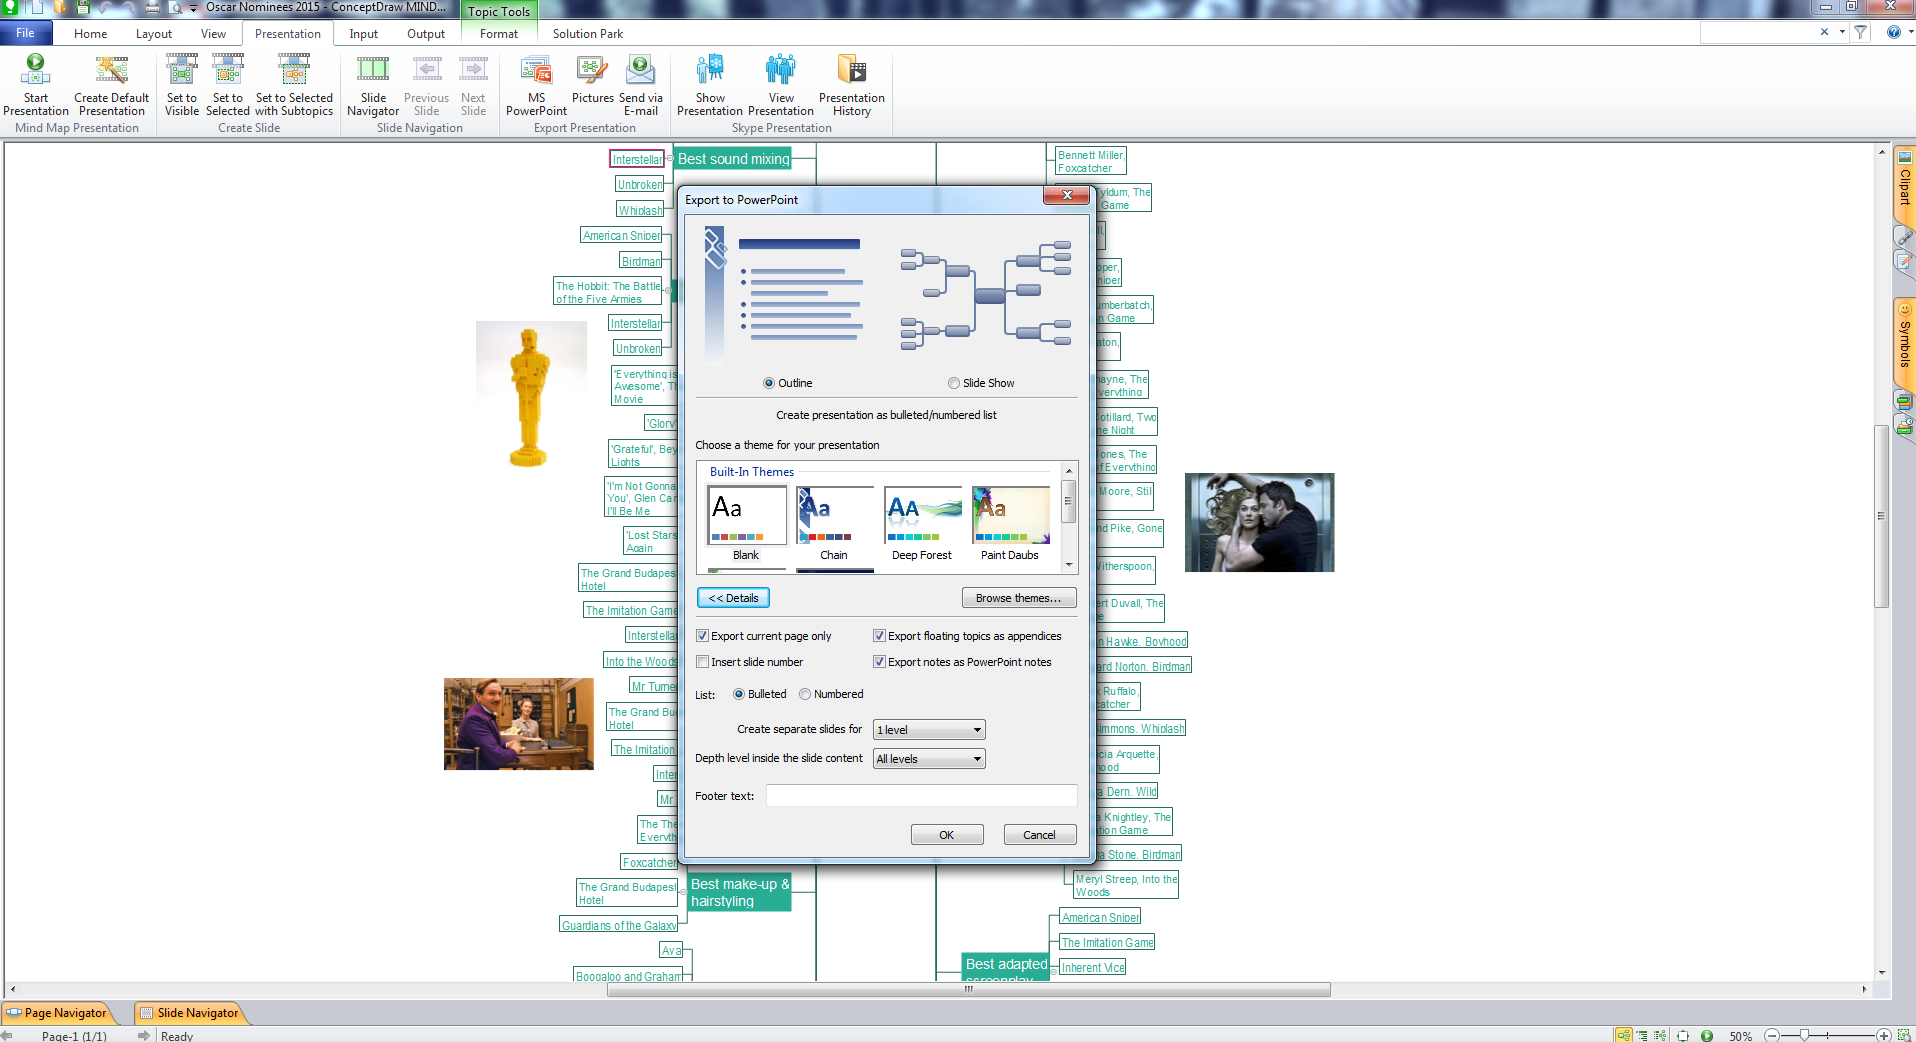
Your mindmap is ready and you may start presentation right from ConceptDraw MINDMAP using the Presentation tab.

Sharing your presentation in popular file formats is also easy and flexible. Go to File menu – Export – MS PowerPoint Presentation and create an Outline or whole map Slideshow. Use standard PowerPoint themes or export to a blank file to customize it further.

Presentation in MINDMAP <br>All in One *

Open your presentation in MS PowerPoint and edit it using custom background, fonts, and pictures.

Presentation in MINDMAP

Your presentation is ready!

You may find this ConceptDraw MINDMAP file on Biggerplate.com


The Benefits for ConceptDraw MINDMAP Software

  • ConceptDraw MINDMAP is effective for brainstorming, designing mind maps, idea generating, creative and lateral thinking, creativity and problem solving.
  • ConceptDraw MINDMAP is ideal for team and personal work in Business, Marketing and Project Management.
  • The libraries with large quantity of vector objects help to illustrate your mind maps and to make them bright, visual and comprehensible.
  • Use of View Navigator tool lets create presentations from a mind map: you can simply select the map parts you want to present, sequence your slides, and preview the presentation.
  • ConceptDraw MINDMAP provides wide capabilities of importing and exporting in various formats: Microsoft PowerPoint, Microsoft Word, MS Excel, Mindjet MindManager, image, HTML, PDF file.


SEVEN RELATED HOW TO's:
The affinity diagram is a business tool used to organize ideas and data. It is one of the Seven Management and Planning Tools. But how design the Affinity Diagram quick and easy? ConceptDraw DIAGRAM diagramming and vector drawing software offers the Seven Management and Planning Tools Solution from the Management Area.Affinity Diagram
Picture: Affinity Diagram
Related Solution:
ConceptDraw Mind maps can be used to depict a quality process.Helpful in all stages of quality management *
Picture: Helpful in all stages of quality management
Related Solution:
Visio Files and ConceptDraw. ConceptDraw DIAGRAM is compatible with MS Visio.VDX formatted files.VDX is Visio’s open XML file format, and it can be easily imported and exported by ConceptDraw DIAGRAM.Visio Files and ConceptDraw *
Picture: Visio Files and ConceptDraw
Video tutorials on ConceptDraw products. Try it today!Presenting Documents with Remote Presentation for Skype Solution *
Picture: Presenting Documents with Remote Presentation for Skype Solution
Related Solutions:
Database model is a graphic representation need at the beginning of project development. You won't have any problems with drawing ER diagrams on a Mac anymore with ConceptDraw DIAGRAM application. Special libraries that contain all the symbols of both Chen's and Crow’s foot notation allow you to start database modeling within a few minutes. Creating entity-relationship diagrams on Mac is fun and effortless when you use a software designed for professional ERD drawing tailored to specific characteristics of Apple OS X. ConceptDraw DIAGRAM is a business diagramming software for those using OS X. The Entity-Relationship Diagrams solution for ConceptDraw has 2 libraries containing about 50 vector icons, depicting ERD symbols of the most popular Chen's and Crow’s Foot Notations. The other valuable component of the solution is a collection of ERDs samples and templates that can be opened on Macs and PCs.Drawing ER diagrams on a Mac *
Picture: Drawing ER diagrams on a Mac
Related Solution:
When thinking about data visualization, one of the first tools that comes to mind is a flowchart design. You can find flowchart symbols, shapes, stencils and icons easily on the Internet, but it might take time to systematize this information. Nevertheless, once you start flowcharting, you’ll love its simplicity and efficiency. This diagram consists from standard flowchart symbols, approved by ANSI (American National Standard Institute) for drawing flowcharts. A flowchart is a diagram that represents a step-by-step algorithm of any process, displaying the process stages as boxes that are connected with arrows. Flowchart design makes it clear and readable. Flowchart designed using ConceptDraw DIAGRAM flowchart software allows to make attractive and clear process presentation, it makes interpretation of the business process flow fresh and versatile. Great flowchart design view is a big advantage over the diagram created manually on a paper.Comparison of bad and good flowchart design showing zigzag flow, crossed connectors, and aligned elements
Picture: Flowchart Design: Principles, Layout, Symbols and Best Practices
Related Solution:
While creating flowcharts and process flow diagrams, you should use special objects to define different statements, so anyone aware of flowcharts can get your scheme right. There is a short and an extended list of basic flowchart symbols and their meaning. Basic flowchart symbols include terminator objects, rectangles for describing steps of a process, diamonds representing appearing conditions and questions and parallelograms to show incoming data. This diagram gives a general review of the standard symbols that are used when creating flowcharts and process flow diagrams. The practice of using a set of standard flowchart symbols was admitted in order to make flowcharts and other process flow diagrams created by any person properly understandable by other people. The flowchart symbols depict different kinds of actions and phases in a process. The sequence of the actions, and the relationships between them are shown by special lines and arrows. There are a large number of flowchart symbols. Which of them can be used in the particular diagram depends on its type. For instance, some symbols used in data flow diagrams usually are not used in the process flowcharts. Business process system use exactly these flowchart symbols.Flowchart example showing a customer request approval process with start, input output, process steps, decision branches, and end
Picture: Flowchart Symbols: Meaning and Examples
Related Solution:
ConceptDraw
MINDMAP 16