Business Graphics Software
Graphic design is a powerful tool to turn interesting ideas into professional visual content. It provides a lot of benefits and is an integral part of business, which is currently highly multifaceted and comprises many different directions. Graphic design is a flexible, cost-effective, and easy-to-use method to advertise your business and a strong foundation of the branding strategy. It greatly impacts business processes, drives marketing and sales making business successful.
Graphic design is an efficient way of visual communication with customers, helps to form a brand identity and build brand awareness. It greatly affects a first impression about your business, goods, and services, makes your brand recognizable and memorable to consumers, and impacts a purchasing decision. Great-looking graphic design improves the user experience, helps to persuade your target audience and convert simple interest into sales. It creates brand heat and makes your business seem professional, reliable, and trustworthy.
High-quality graphic design is the face of your business. A company's logo, website, business card design, marketing and promotion materials are some of the most important business elements, the basis of efficient marketing and promotional campaigns both on the web and outside it. It is because visual information is perceived the most efficiently and visual graphics, illustrations, infographics, images, and charts are efficient in getting your message across to the target audience, current and potential clients.
Graphics is a key to connecting to the audience because most people respond better to visual information than plain text. Graphic design helps to transform large blocks of content into interesting and appealing. It blends photography, image, motion, clipart, and other graphics together to create exclusive and eye-catching designs. Well-considered design and impressive graphics make your brand look professional and reliable, catch attention, engage more customers, retain them to interact with your brand, and encourage them to come back.
Graphics is associated with your business and being memorable and recognizable, it helps both small and large business to stand out among the competition. The term "going viral" is even used in marketing and means high recognition of your brand that is achieved due to great efforts and great work of specialists in marketing and design. Graphic design boosts your authority in the market, builds up trust with your customers, and finally turns you into an industry leader.
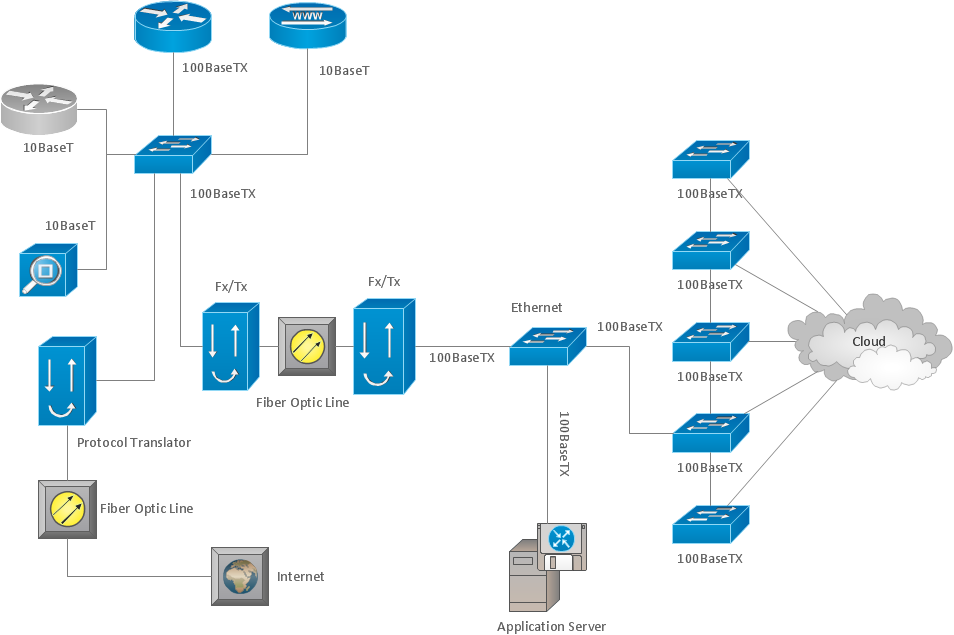
Example 1. Business Graphics Software ConceptDraw DIAGRAM
Promotion has a goal to keep your brand in a customer’s mind long after he sees it anywhere and a graphical image is the best way to achieve this. Graphic design is an efficient way of attractive presentation of a brand, product, or service to the target audience. It helps to wonder clients, set visual and emotional contact with the target audience, create awareness, and make the brand image stronger. It also gives clarity to the information and makes it easier to understand through correct arranging and highlighting key points.
Graphic design is important for both printed and digital materials used for the company's website and social media. Because an image is the first that attracts the audience and the text is in the second place. Strong graphic designs are created based on the research of customers' wants, needs, and satisfaction at considering artistic rules, psychological patterns, harmony, and color impact on humans. At the same time, there are no limits in creating attractive content to promote your business.
Brochures, business cards, handouts, signs, posters, magazines, flyers, leaflets, and other published content are popular and valuable alongside digital graphics and video content. This field actively develops and new trends and new ideas for distinctive visual elements are always highly valued. Well-thought-out and effective designs affect both customer loyalty and employee loyalty and cause in them a sense of pride for the company, which also has a great positive effect on the company's growth and development.

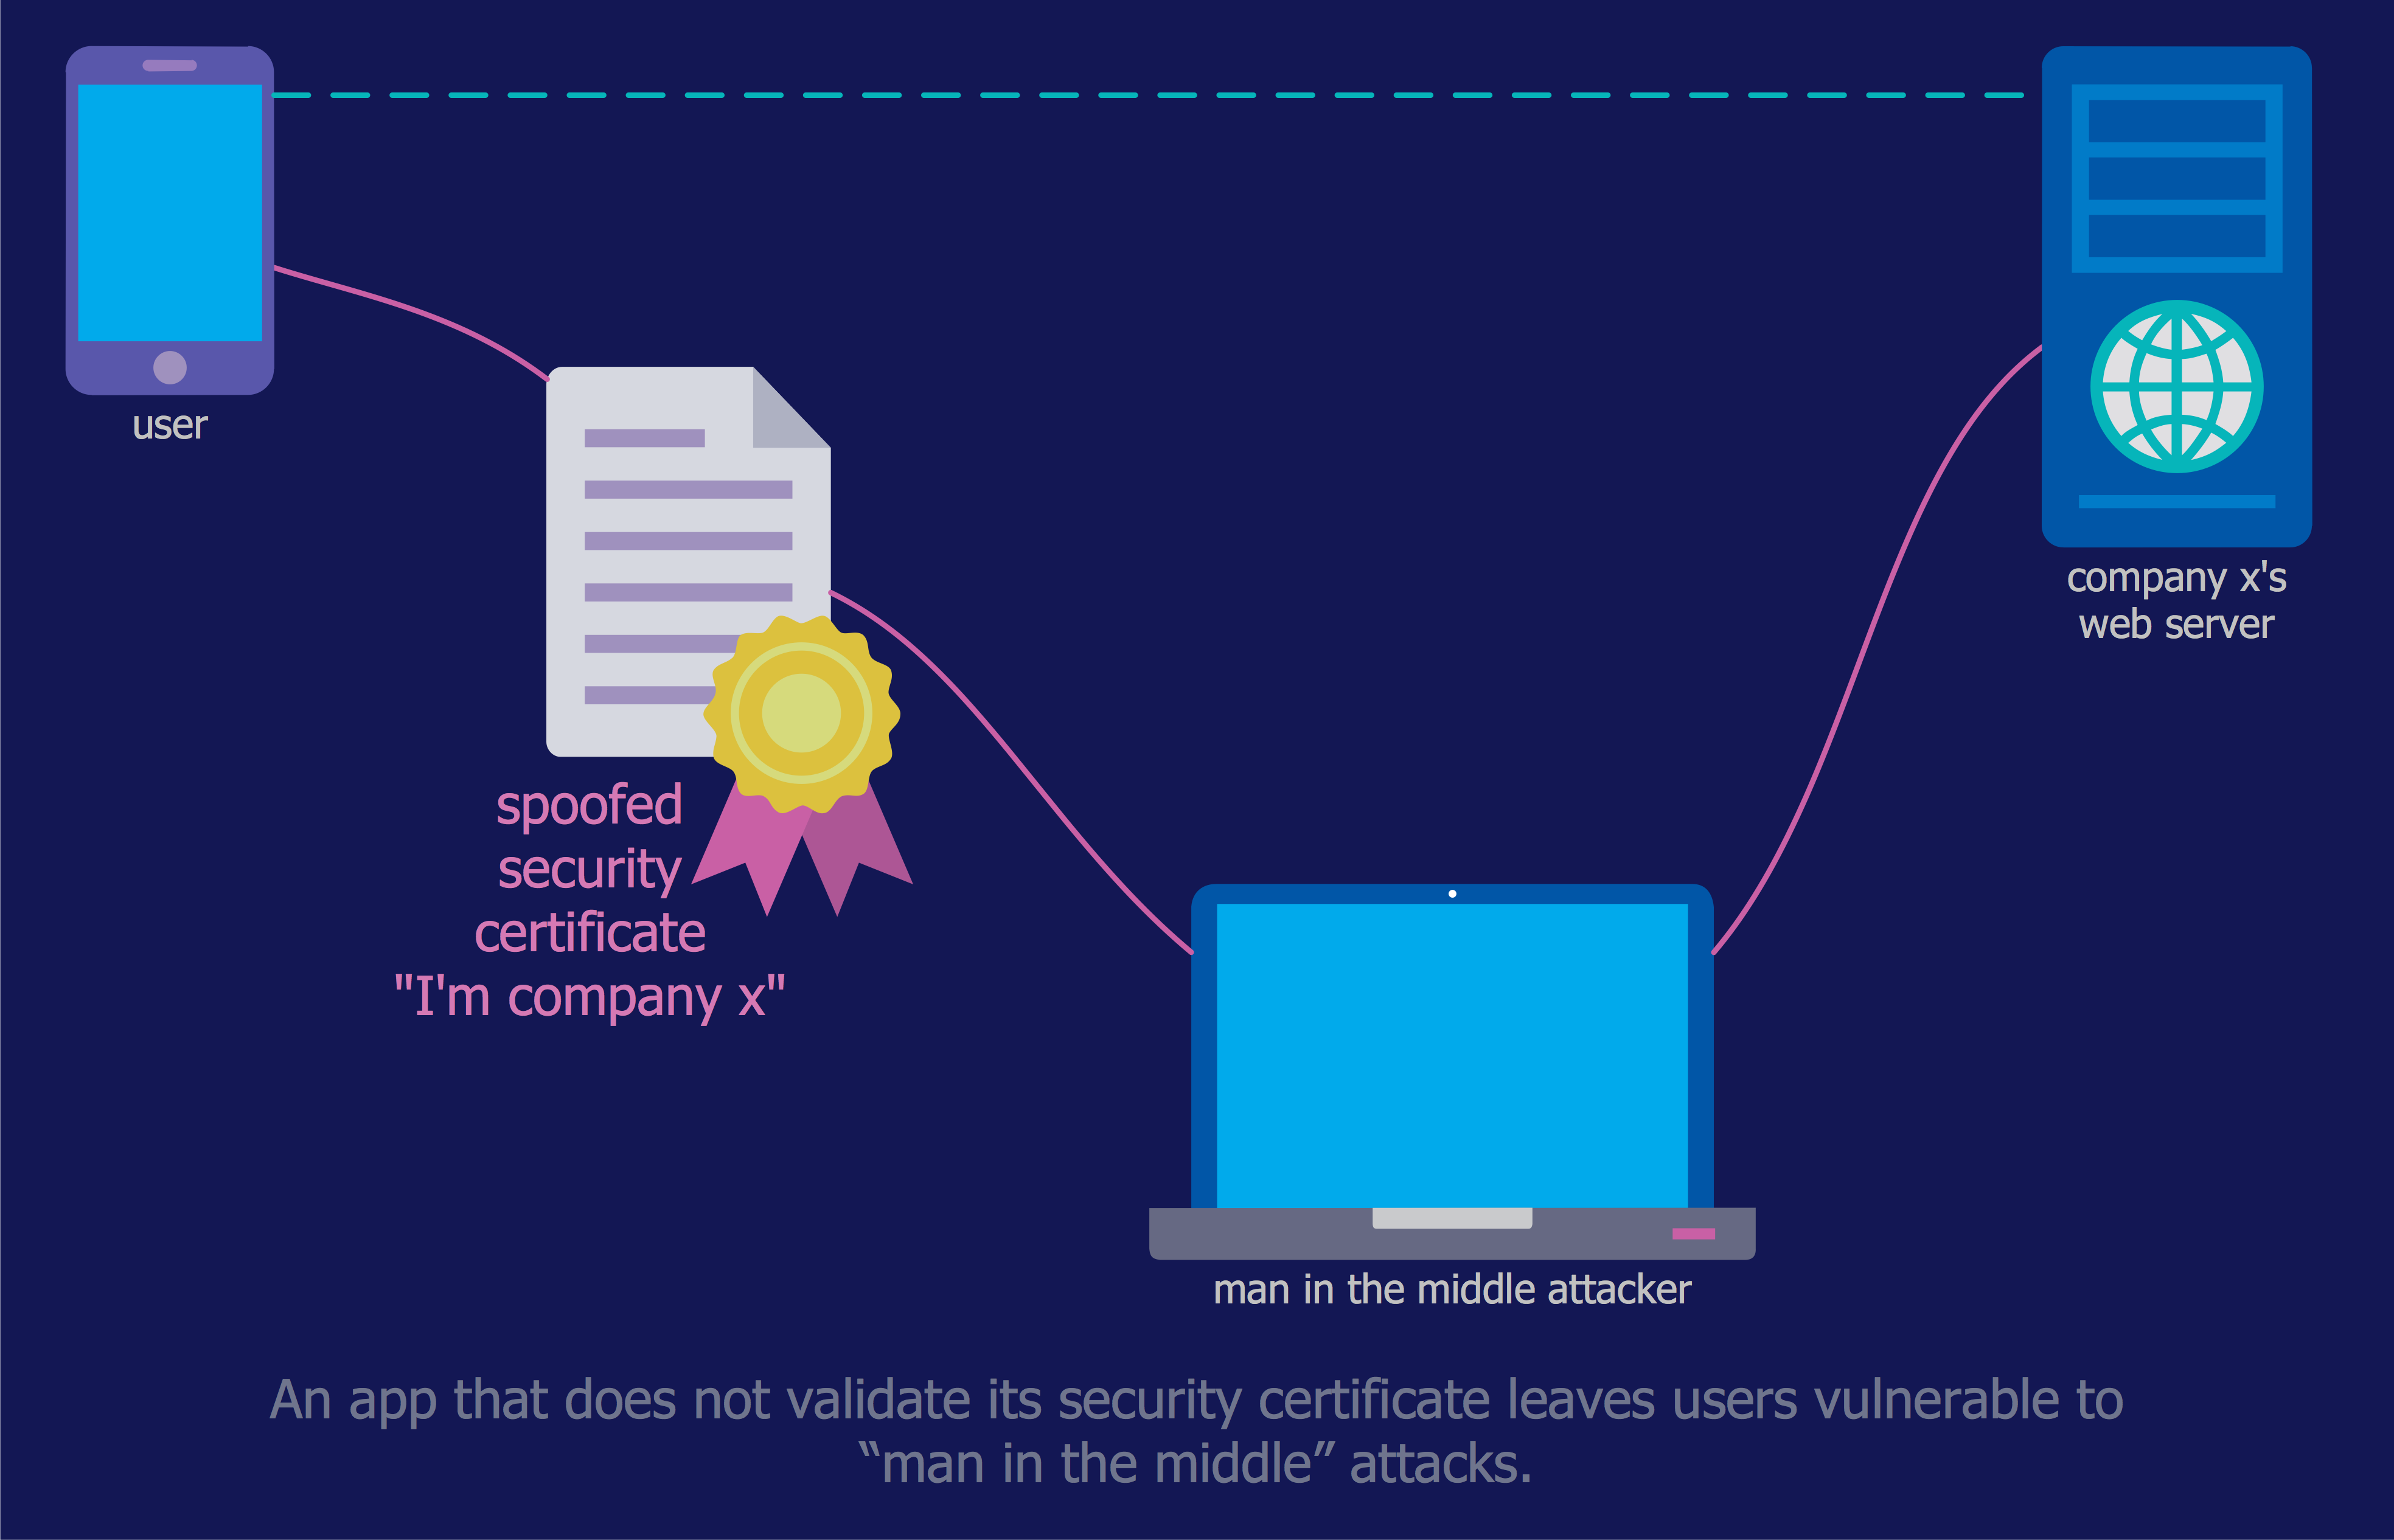
Example 2. Business Process Workflow Diagrams Design Elements
ConceptDraw DIAGRAM business graphics software provides wide opportunities for creativity and helps generate amazing visuals by using the included drawing tools, libraries of pre-made vector elements and clipart, templates, and samples. Satisfy the needs of any organization and reach the heart of your target audience. Creatively designed graphics can communicate ideas and information more efficiently. Capture the attention of the target audience by creating a professional image of your business, improve brand visibility and enhance its recognition, enhance trust and credibility, open new avenues of business, and improve sales and revenue through harmonic composition.
Grow and improve your business through appealing graphic design impacting awareness and forming a visual identity. Boost your brand awareness and recognition through graphic design. Create well-designed, attractive, and stylish graphical content in ConceptDraw DIAGRAM enhanced with Business Process Workflow Diagrams solution to provide a positive impact on your customers and clients and increase your company’s visibility. Design a memorable brand and logo that is a true representation of your business values. Help them stay long in customers’ minds and become a recognizable part of your business. Create distinct and memorable visuals to grab the attention of your audience, convert leads, stand out against the competition, and create an edge over it. Optimize business processes structure and analysis of business processes efficiently with ConceptDraw DIAGRAM.
To get the most out of your graphic design, make your infographics, illustrations, and diagrams colorful and attractive. Make visual accents correctly to capture attention and highlight important things with colors or differentiated fonts. However, don't go overboard because flashy colors are not always appropriate. The colorful graphics are pleasing to the eyes, impact positive first impression, and make reading the content more interesting. Give lightness and simplicity to your graphics, do not clutter or overcrowd. Enhance user experience efficiently in intense competition.

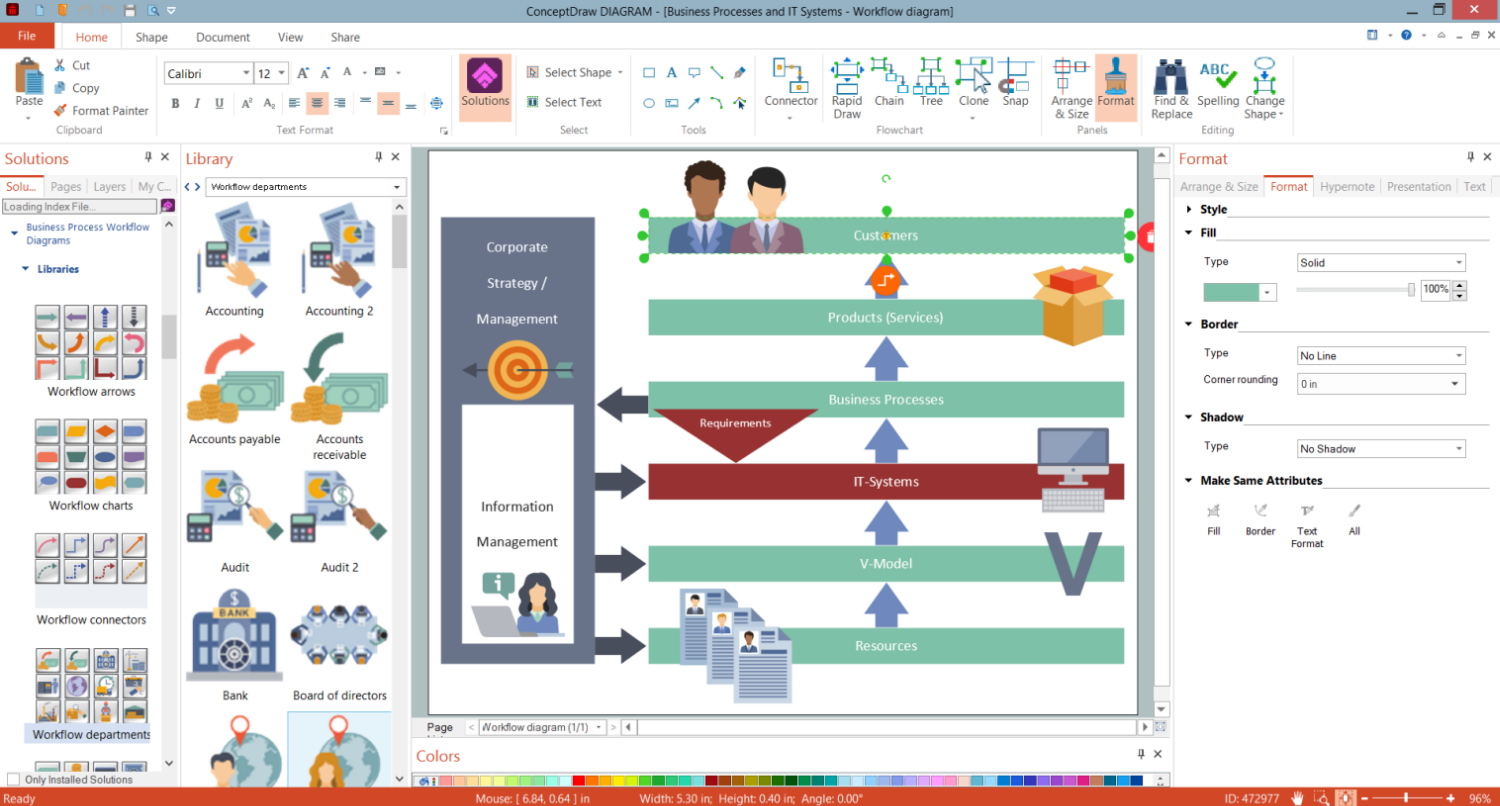
Example 3. Business Processes Structure and Analysis
The samples you see on this page were created in ConceptDraw DIAGRAM using the Business Process Workflow Diagrams Solution for ConceptDraw DIAGRAM They successfully demonstrate solution's capabilities and professional results you can achieve using it. An experienced user spent 10 minutes creating each of these samples.
Use the Business Process Workflow Diagrams Solution for ConceptDraw DIAGRAM software to create your own professional looking Business Process Flow Diagram quick, easy and effective, and then successfully use it in your work activity.
All source documents are vector graphic documents. They are available for reviewing, modifying, or converting to a variety of formats (PDF file, MS PowerPoint, MS Visio, and many other graphic formats) from the ConceptDraw STORE. The Business Process Workflow Diagrams Solution is available for all ConceptDraw DIAGRAM or later users.