Example 1. Business Process Optimization
Powerful and helpful tools of Business Process Workflow Diagrams Solution will be incredibly helpful when implementing business process optimization and drawing Business Process Workflow diagrams, schematics and infographics.

Example 2. Business Process Workflow Diagrams Solution in ConceptDraw STORE
Business Process Workflow Diagrams Solution provides a lot of predesigned samples of Business Process Workflow Diagrams, which are available from ConceptDraw STORE, and 10 libraries with numerous vector objects of workflow chart elements, icons, arrows, connectors, and workflow clipart:
- Workflow Arrows
- Workflow Charts
- Workflow Connectors
- Workflow Departments
- Workflow Finance
- Workflow IT and Security
- Workflow Management
- Workflow Marketing and Sales
- Workflow Office
- Workflow Steps

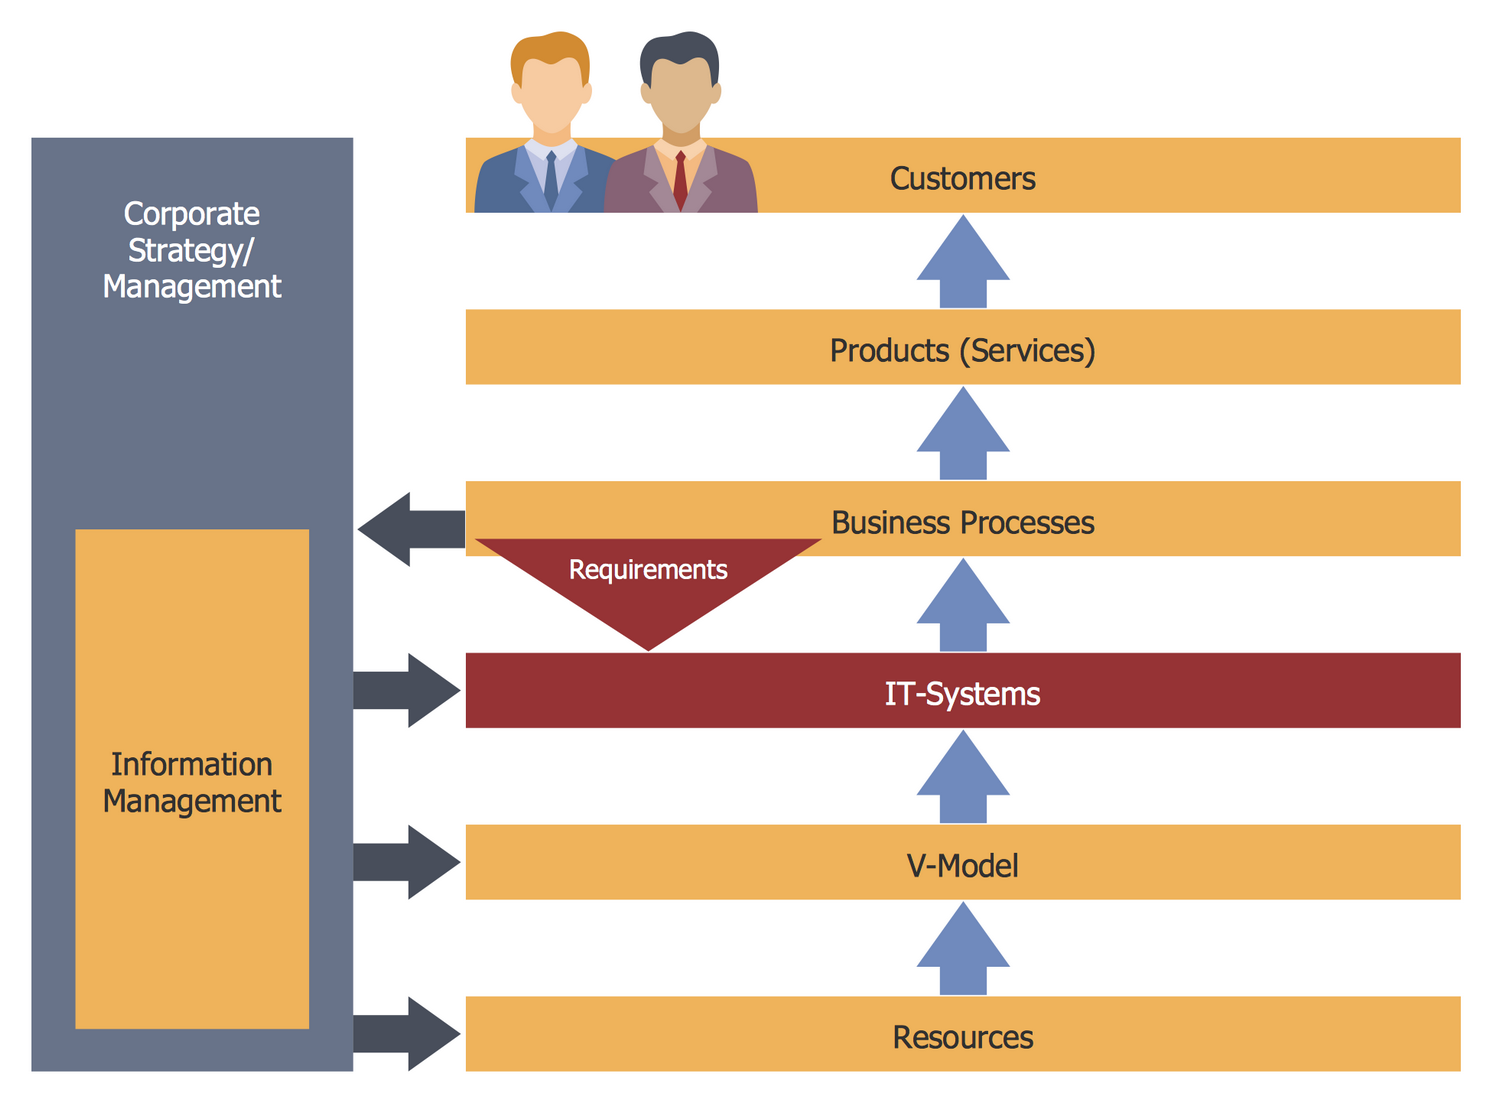
Example 3. Organization Development and Business Process Reengineering
The business process optimization samples you see on this page were created in ConceptDraw DIAGRAM using the objects from the libraries of Business Process Workflow Diagrams Solution. An experienced user spent 5-10 minutes creating each of these examples.
Use the tools of Business Process Workflow Diagrams Solution for ConceptDraw DIAGRAM software for effective business process optimization.
All source documents are vector graphic documents. They are available for reviewing, modifying, or converting to a variety of formats (PDF file, MS PowerPoint, MS Visio, and many other graphic formats) from the ConceptDraw STORE. The Business Process Workflow Diagrams Solution is available for all ConceptDraw DIAGRAM or later users.
TEN RELATED HOW TO's:
ConceptDraw DIAGRAM is the best BPMN software for ✔️ modeling business processes, ✔️ graphical documenting processes, ✔️ analysis processes, ✔️ optimization business processes, ✔️ identifying inefficiencies, ✔️ efficient decision-making based on created Business Process Diagrams and Business Process Models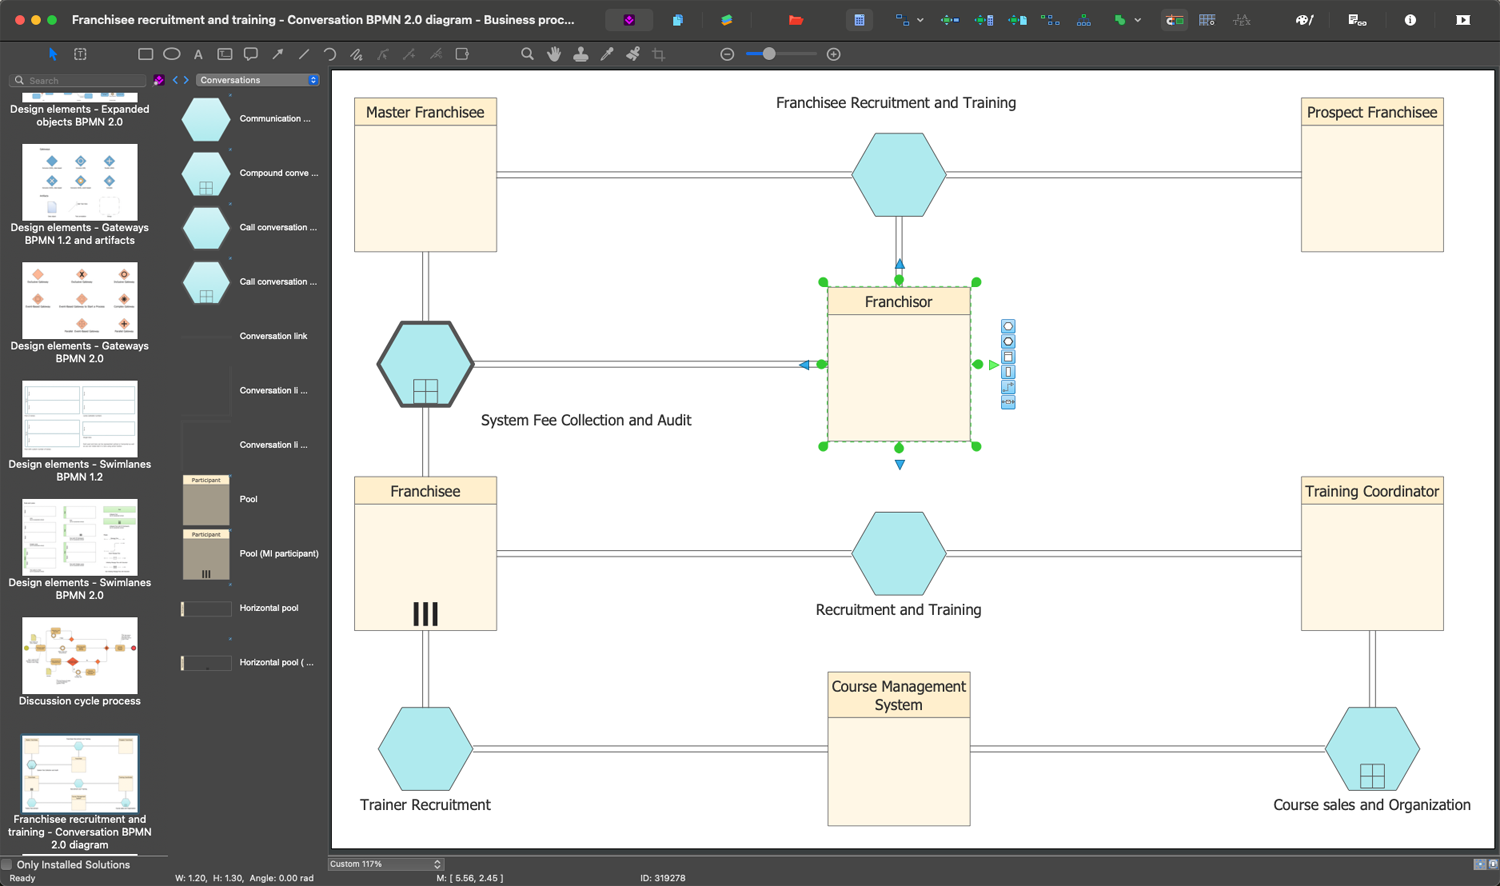
Picture: The Best Business Process Modeling Software: Comprehensive Guide
Related Solution:
A competent delegation of responsibilities between workers guarantees business success in most cases. At first sight, it might seem that workflow diagram symbols are quite similar to a regular flowchart. But workflow diagram is a more accurate way to present working processes.
Workflow diagrams are helpful for a working process analyzation, to depict a pathway of process issues, personalize responsibilities and identify resources that will help to optimize a workflow. Generally, Workflow diagram deploys flowchart symbols for displaying work process steps and relationships. But, often it require some additions and improvements to become more professional and illustrative. The Workflow solution for ConceptDraw DIAGRAM provides the user with a big library of symbols that are designed especially for workflow diagrams.
Picture: Workflow Diagram Symbols
Related Solution:
The EPC diagram shows various business processes in terms of work flows.
Event-Driven Process chain Diagrams for improvement throughout an organisation.
ConceptDraw DIAGRAM - software that reduces the time needed to create a business process model and is great business process improvement tools.
Picture: The Best Tool for Business Process Modeling
Related Solution:
Purchasing Workflow Chart as a methods for documenting accounting information systems. Symbols and Methods for designing Accounting System.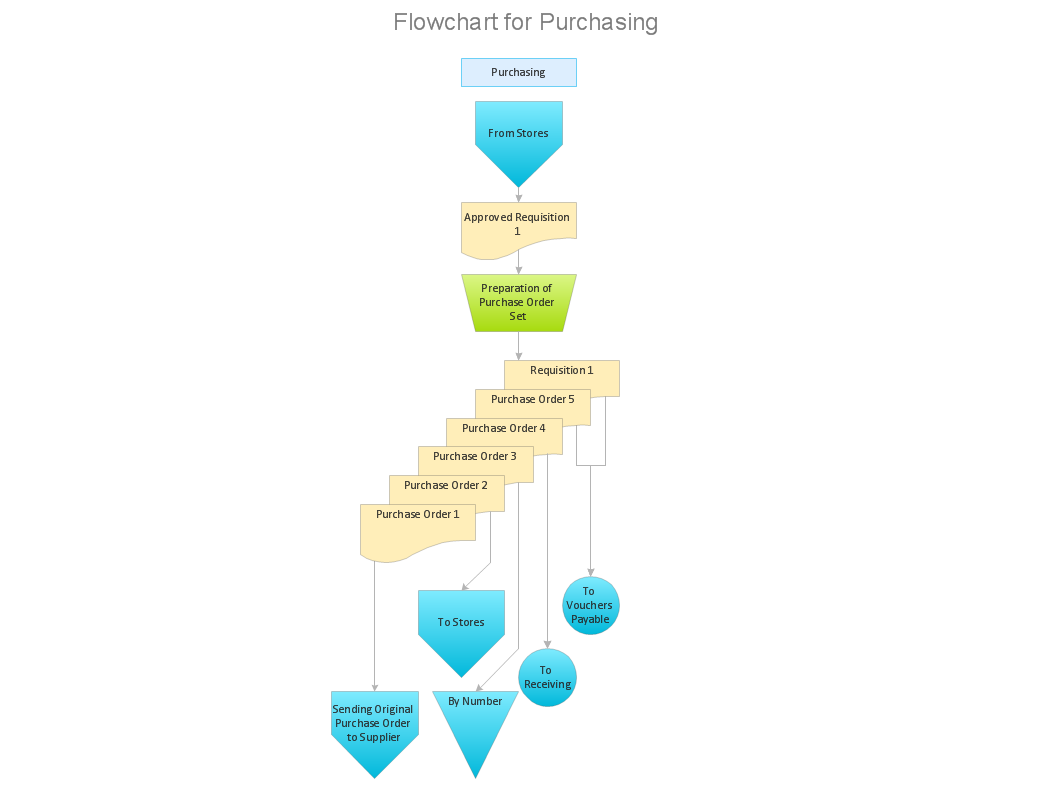
Picture: Workflow to Make a Purchase.Accounting Flowchart Example
Related Solution:
Create bar graphs for visualizing economics problem solving and financial data comparison using the ConceptDraw DIAGRAM diagramming and vector drawing software extended with the Bar Graphs Solution from the Graphs and Charts area of ConceptDraw Solition Park.
Picture: Bar Diagrams for Problem Solving.Create economics and financial bar charts with Bar Graphs Solution
Related Solution:
Create business process diagrams (BPMN 2.0.) with ConceptDraw using professional looking templates. ConceptDraw is business process improvement tools.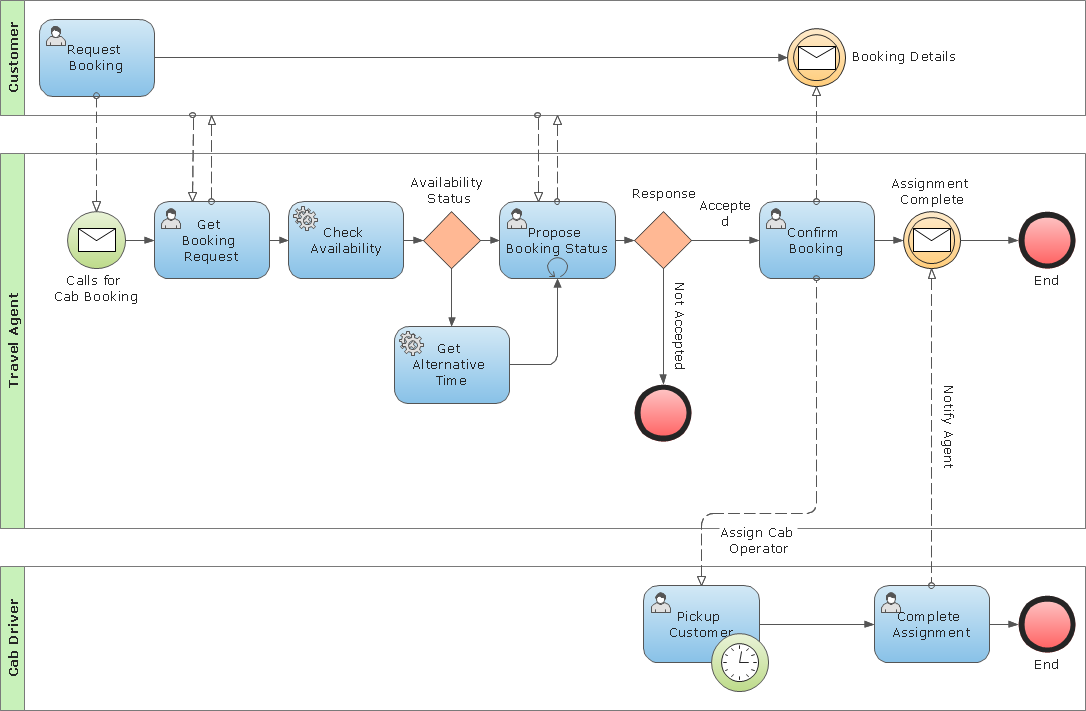
Picture: Business Process Modeling Notation Template
Functional modeling allows to make complex business processes simple. One of the basic methods is IDEF0 and one of the most effective also. To create a business model, use flowchart symbols.
The IDEF0 library, supplied with ConceptDraw IDEF0 Diagrams solution contains 18 IDEF0 basic notation symbols. All symbols are the vector graphic images what means, that one can customize their size preserving the stable quality. Another library of IDEF0 symbols can be find out in the the Business Process Diagrams solution, included to the Business Processes section of ConceptDraw Solution Park. These libraries composed from just vector objects and are totally compatible. You can apply the IDEF0 symbols from both libraries at your flowcharts, if needed.
Picture: IDEF0 Flowchart Symbols
Related Solution:
When thinking about data visualization, one of the first tools that comes to mind is a flowchart design. You can find flowchart symbols, shapes, stencils and icons easily on the Internet, but it might take time to systematize this information. Nevertheless, once you start flowcharting, you’ll love its simplicity and efficiency.
This diagram consists from standard flowchart symbols, approved by ANSI (American National Standard Institute) for drawing flowcharts. A flowchart is a diagram that represents a step-by-step algorithm of any process, displaying the process stages as boxes that are connected with arrows. Flowchart design makes it clear and readable.
Flowchart designed using ConceptDraw DIAGRAM flowchart software allows to make attractive and clear process presentation, it makes interpretation of the business process flow fresh and versatile. Great flowchart design view is a big advantage over the diagram created manually on a paper.
Picture: Flowchart Design: Principles, Layout, Symbols and Best Practices
Related Solution:
In software engineering, it is important to understand how the system would cooperate with external sources, like data sources. To give this information a visual representation, data flow diagrams (DFD) were used for years. The entire system is usually divided into smaller ones, and all of them process data flows in appropriate ways.
The visualizing business processes which engages the data transfer, is commonly preformed using DFDs (data flow diagrams). DFD is used to show the data flow processing and transformation. This DFD represents the electronic system of a customer purchase. It was created using Gane/Sarson notation. Data flow diagrams helps you to sort through and clarify transferring process making it available for analysis, and representation. ConceptDraw DFD solution introduces the vector library, containing the full set of icons from DFD notations.
Picture: Data Flow Diagram (DFD)
Related Solution:
Use the set of special professionally developed swim lane flowchart symbols - single, multiple, vertical and horizontal lanes from the Swimlanes and Swimlanes BPMN 1.2 libraries from the Business Process Diagram solution, the Swim Lanes library from the Business Process Mapping solution as the perfect basis for your Swim Lane Flowcharts of processes, algorithms and procedures.
Picture: Swim Lane Flowchart Symbols
Related Solution:

