Made with
ConceptDraw
DIAGRAM 17

Business Process Flow Diagram

Business Process Flow Diagram is a graphical presentation of business processes and process flows. Business Process Flow Diagrams are one of the main tool of business analysis and business process re-engineering. They let identify and easy understand process flows within organization, the parts that form the flow and visually represent who interacts with what.

ConceptDraw DIAGRAM extended with Business Process Workflow Diagrams solution from the Business Processes area of ConceptDraw Solution Park is a powerful software which lets easy design Business Process Flow Diagram of any complexity.

Business Process Flow Diagram *

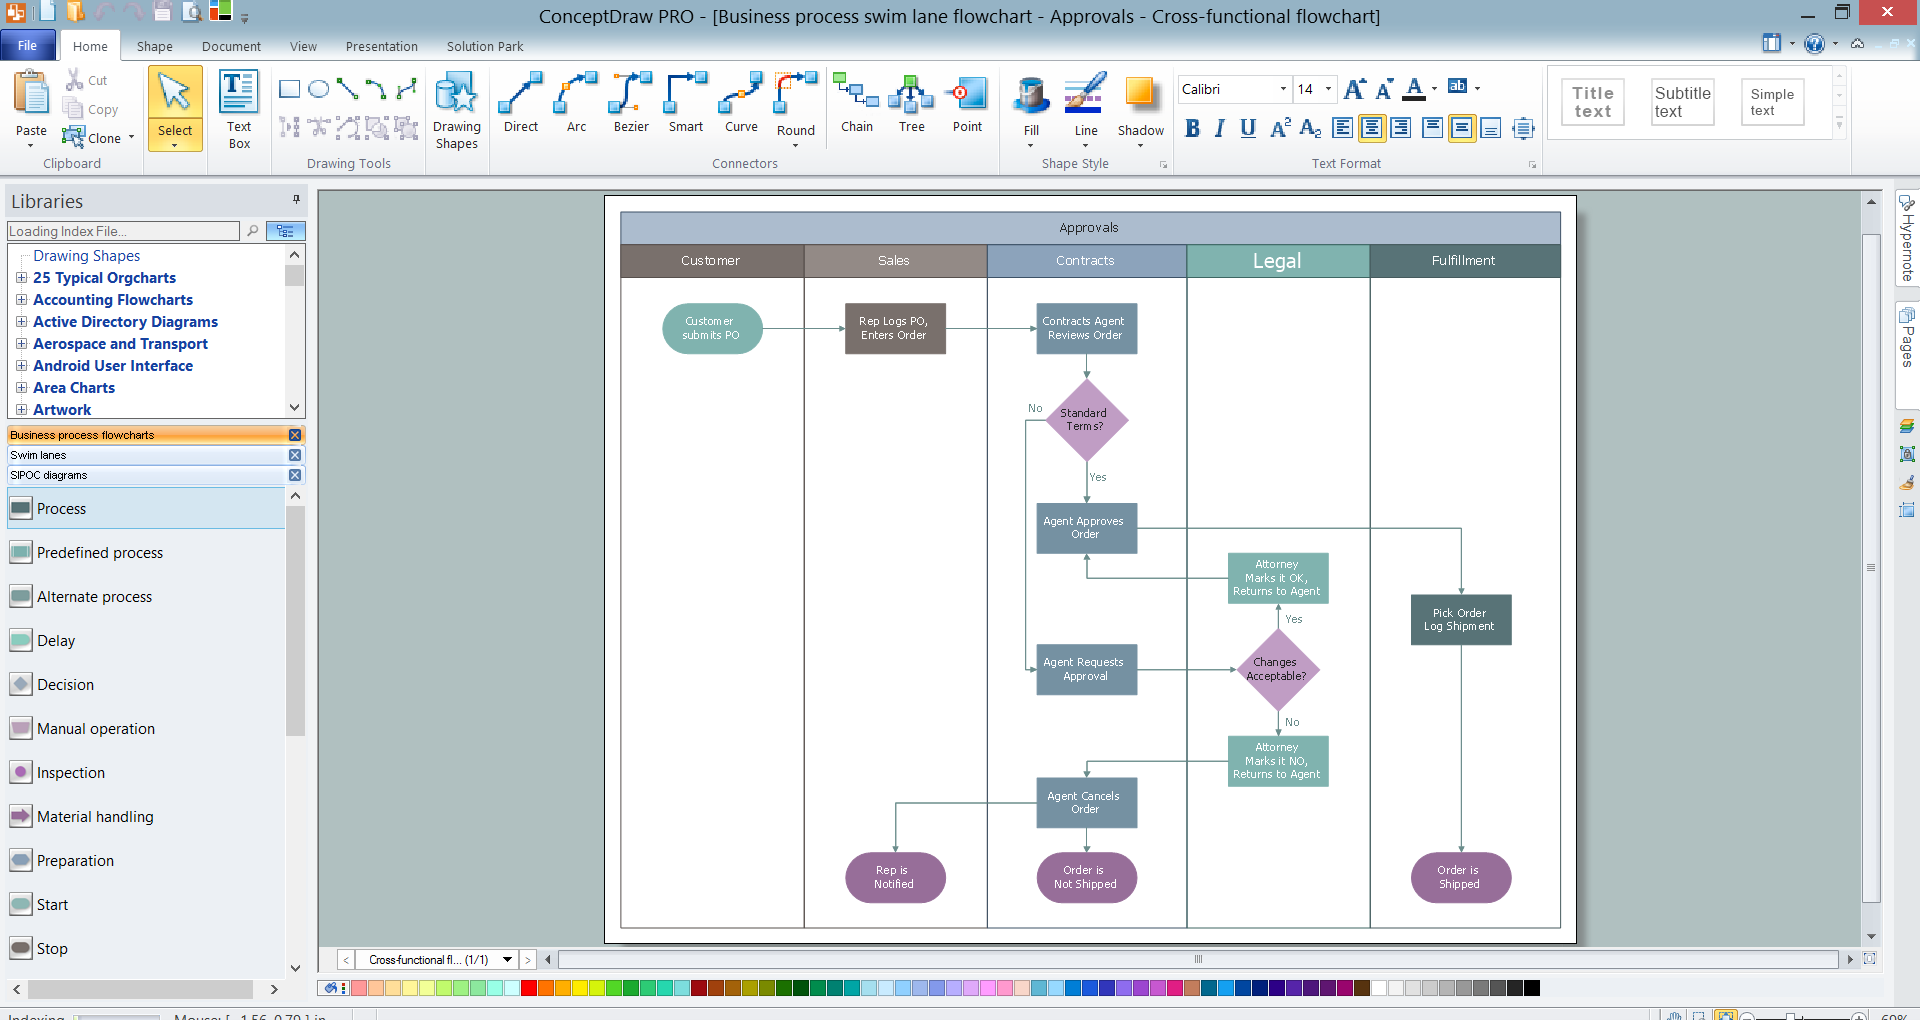
Example 1. Business Process Flow Diagram

Business Process Workflow Diagrams Solution for ConceptDraw DIAGRAM allows you to draw complex and detailed Business Process Flow Diagrams. It offers a number of libraries - 10 libraries with 317 ready-to-use vector objects which make the drawing process fast and easy.

Business Process Workflow Diagrams Solution includes also variety of professionally designed samples and examples represented at ConceptDraw STORE. Any Business Process Flow Diagram you desire can be easy opened in ConceptDraw DIAGRAM and used as a quick start when drawing your own diagram.

Pay special attention to the style of your diagram, a lot of formatting settings of ConceptDraw DIAGRAM provide an excellent opportunity to make your Business Process Flow Diagrams unique, colorful and attractive.

Government Records Cataloging Flow

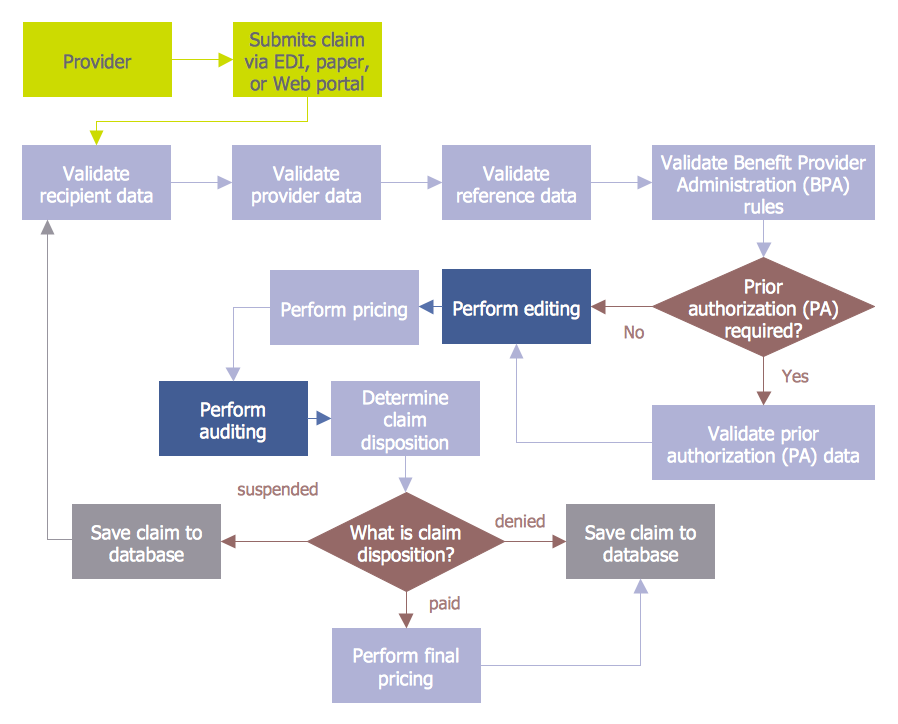
Example 2. Government Records Cataloging Flow

The samples you see on this page were created in ConceptDraw DIAGRAM using the Business Process Workflow Diagrams Solution for ConceptDraw DIAGRAM They successfully demonstrate solution's capabilities and professional results you can achieve using it. An experienced user spent 10 minutes creating each of these samples.

Use the Business Process Workflow Diagrams Solution for ConceptDraw DIAGRAM software to create your own professional looking Business Process Flow Diagram quick, easy and effective, and then successfully use it in your work activity.

All source documents are vector graphic documents. They are available for reviewing, modifying, or converting to a variety of formats (PDF file, MS PowerPoint, MS Visio, and many other graphic formats) from the ConceptDraw STORE. The Business Process Workflow Diagrams Solution is available for all ConceptDraw DIAGRAM or later users.


TEN RELATED HOW TO's:
Using diagrams, you can visualize the flow of the information or build a detailed data structure. There's no need to have a degree in software and database design with ConceptDraw DIAGRAM , because this software has all the tools needed in developing models and diagrams. Project planning, designing and prototyping was never so easy. This UML diagrams can be used to visualize a model of the data base development process. A UML diagram shows a graphical view of a structure of software system: components and relationships. Using Unified Modeling Language helps to depict logical and physical elements of a data base, visually represent requirements and sub-systems. UML diagrams allows developers to organize and predict critical issues, as well as collaborate data base information.Software and Database Design with ConceptDraw DIAGRAM  *
Picture: Software and Database Design with ConceptDraw DIAGRAM
Related Solution:
A process flowchart is a picture of the separate steps of a process in sequential order.Use ConceptDraw DIAGRAM software and the vector stencils from object libraries are designed objects you can use adding to process flowcharts for the best result.Create Process Flowcharts *
Picture: Create Process Flowcharts
Related Solution:
What is the accounting cycle? The accounting cycle is a sequence of steps that occur in the accounting period and include the processes of identifying, collecting, analyzing documents, recording transactions, classifying, summarizing, and reporting financial information of an organization.What is the Accounting Cycle? *
Picture: What is the Accounting Cycle?
Related Solution:
This sample was created in ConceptDraw DIAGRAM diagramming and vector drawing software using the Flowcharts solution from the Diagrams area of ConceptDraw Solution Park. A Flowchart is a graphically representation of the process, algorithm or the step-by-step solution of the problem. The Flowcharts have one or more starting and ending points. The geometric figures on the Flowcharts represent the steps of the process and are connected with arrows that show the sequence of the actions.Horizontal Flowchart *
Picture: Horizontal Flowchart
Related Solution:
A database is a data collection, structured into some conceptual model. Two most common approaches of developing data models are UML diagrams and ER-model diagrams. There are several notations of entity-relationship diagram symbols and their meaning is slightly different. Crow’s Foot notation is quite descriptive and easy to understand, meanwhile, the Chen notation is great for conceptual modeling. An entity relationship diagrams look very simple to a flowcharts. The main difference is the symbols provided by specific ERD notations. There are several models applied in entity-relationship diagrams: conceptual, logical and physical. Creating an entity relationship diagram requires using a specific notation. There are five main components of common ERD notations: Entities, Actions, Attributes, Cardinality and Connections. The two of notations most widely used for creating ERD are Chen notation and Crow foot notation. By the way, the Crow foot notation originates from the Chen notation - it is an adapted version of the Chen notation.ERD Symbols and Meanings
Picture: ERD Symbols and Meanings
Related Solution:
The excellent possibility to create attractive Cross Functional Flowcharts for step-by-step visualization the operations of a business process flow of any degree of detailing is offered by ConceptDraw’s Cross-Functional Flowcharts solution. The extensive selection of commonly used vector cross functional flowchart symbols allow you to demonstrate the document flow in organization, to represent each team member’s responsibilities and how processes get shared or transferred between different teams and departments.Cross Functional Flowchart Symbols *
Picture: Cross Functional Flowchart Symbols
Related Solution:
The most easier way of creating the visually engaging and informative Sales Process Flowchart is to create the new ConceptDraw document and to use the predesigned vector symbols offered in 6 libraries of the Sales Flowchart Solution. There are more than six types of sales process flow diagrams, ConceptDraw DIAGRAM software is flowchart maker which include six collections of extended flowchart symbols for effective diagramming. There are main collections of color coded flowchart symbols: Sales Department, Sales Steps, Sales Workflow, Sales Symbols and special set of Sales Arrows and Sales Flowchart.Sales Process Flowchart Symbols *
Picture: Sales Process Flowchart Symbols
Related Solution:
Create flowcharts, flow charts, and more with ConceptDraw flowchart software.Basic Diagramming *
Picture: Basic Diagramming. Flowchart Software
Related Solution:
A waterfall model describes software development process as a sequence of phases that flow downwards. SSADM is one of the implementations of waterfall method. It’s easier to learn about structured systems analysis and design method (SSADM) with ConceptDraw DIAGRAM because this software has appropriate tools for creating data flow diagrams. You can use all the three main techniques of SSADM method with special tools and predesigned templates. This data flow diagram illustrates the Structured Systems Analysis and Design Method. This method method considers analysis, projecting and documenting of information systems. Data flow models are the most important elements of SSADM and data flow diagrams are usually used for their description. It includes the analysis and description of a system as well as visualization of possible issues.Structured Systems Analysis and Design Method
Picture: Structured Systems Analysis and Design Method. SSADM with ConceptDraw DIAGRAM
Related Solution:
ConceptDraw
DIAGRAM 17