Agile Methodology
Agile methodology is a series of approaches to software development and ways of managing small IT development teams and projects. It is effective methodology and excellent alternative to waterfall and traditional sequential development.
Agile is effective methodology aimed at the minimization risks by division a development process on the series of short cycles called iterations, that typically last 2-3 weeks. At the end of each iteration, the team executes the reevaluation the priorities of development. Preferring direct communication face-to-face, the agile methods reduce the amount of written documentation in comparison with other methods.
There are few agile methodologies, the most popular are:
- Dynamic systems development method (DSDM) - an iterative and incremental approach of software development which includes continuous customers involvement;
- Feature-driven development (FDD) is a lightweight methodology the main goal of which is to develop of real, working software in a set time frame;
- Extreme programming (XP) - is a method which lets improve software development and create software capable to effectively respond to the changing requirements;
- Scrum - the most popular and widely used agile development method which is a flexible development strategy when a team works as a unit for achievement a common goal.
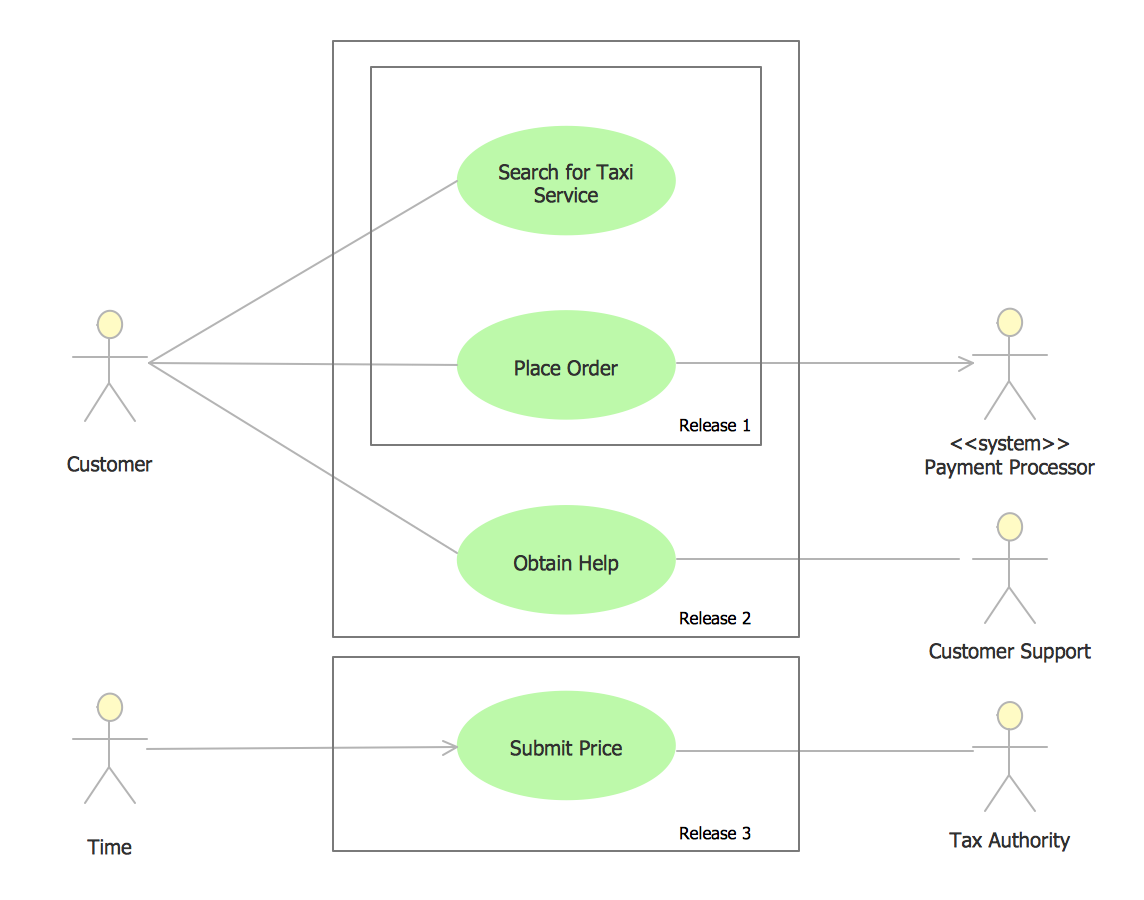
ConceptDraw DIAGRAM extended with SCRUM Workflow solution from the Project Management area of ConceptDraw Solution Park is a powerful diagramming and vector drawing software, ideal for quick and easy designing various diagrams, charts, mind maps and schematics illustrating software development using Agile methodologies, and in particular Scrum methodology.

Example 1. Agile Methodology
To help you easy design diagrams, SCRUM Workflow Solution offers 8 libraries with numerous collection of scrum design elements and vector objects:
- Scrum Arrows
- Scrum Artifacts
- Scrum Charts
- Scrum Clipart
- Scrum Diagrams
- Scrum People
- Scrum Workflow
- Scrum Workspace

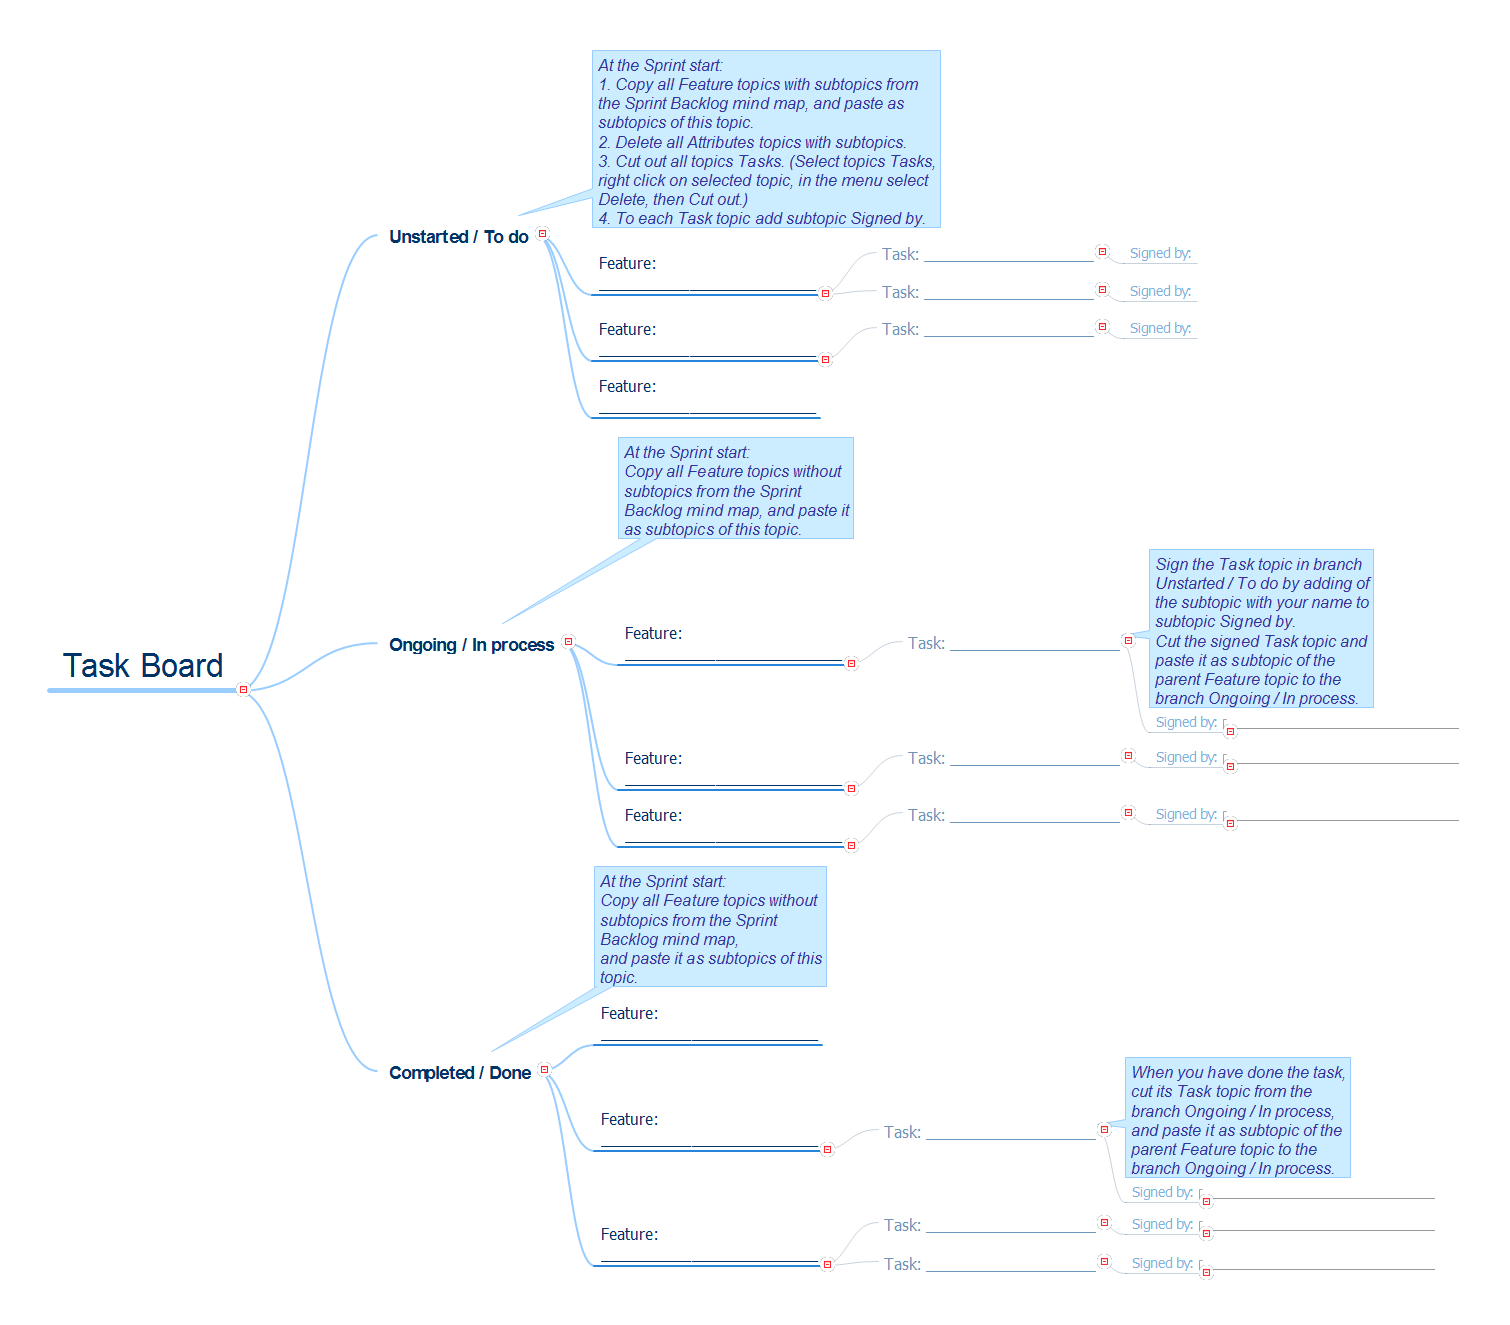
Example 2. Scrum Design Elements
Follow few simple steps to design any diagram with SCRUM Workflow solution:
- drag required objects from the libraries and organize them,
- type the title and text,
- use Line, Fill, Shadow, and Text tools to format diagram objects.

Example 3. SCRUM Workflow Solution in ConceptDraw STORE
You can also benefit from the collection of well thought-out, bright and attractive samples offered in large quantity by SCRUM Workflow solution at ConceptDraw STORE. You can open any of them in ConceptDraw DIAGRAM and change something according to your needs to get already new diagram which can be then successfully used at your work.
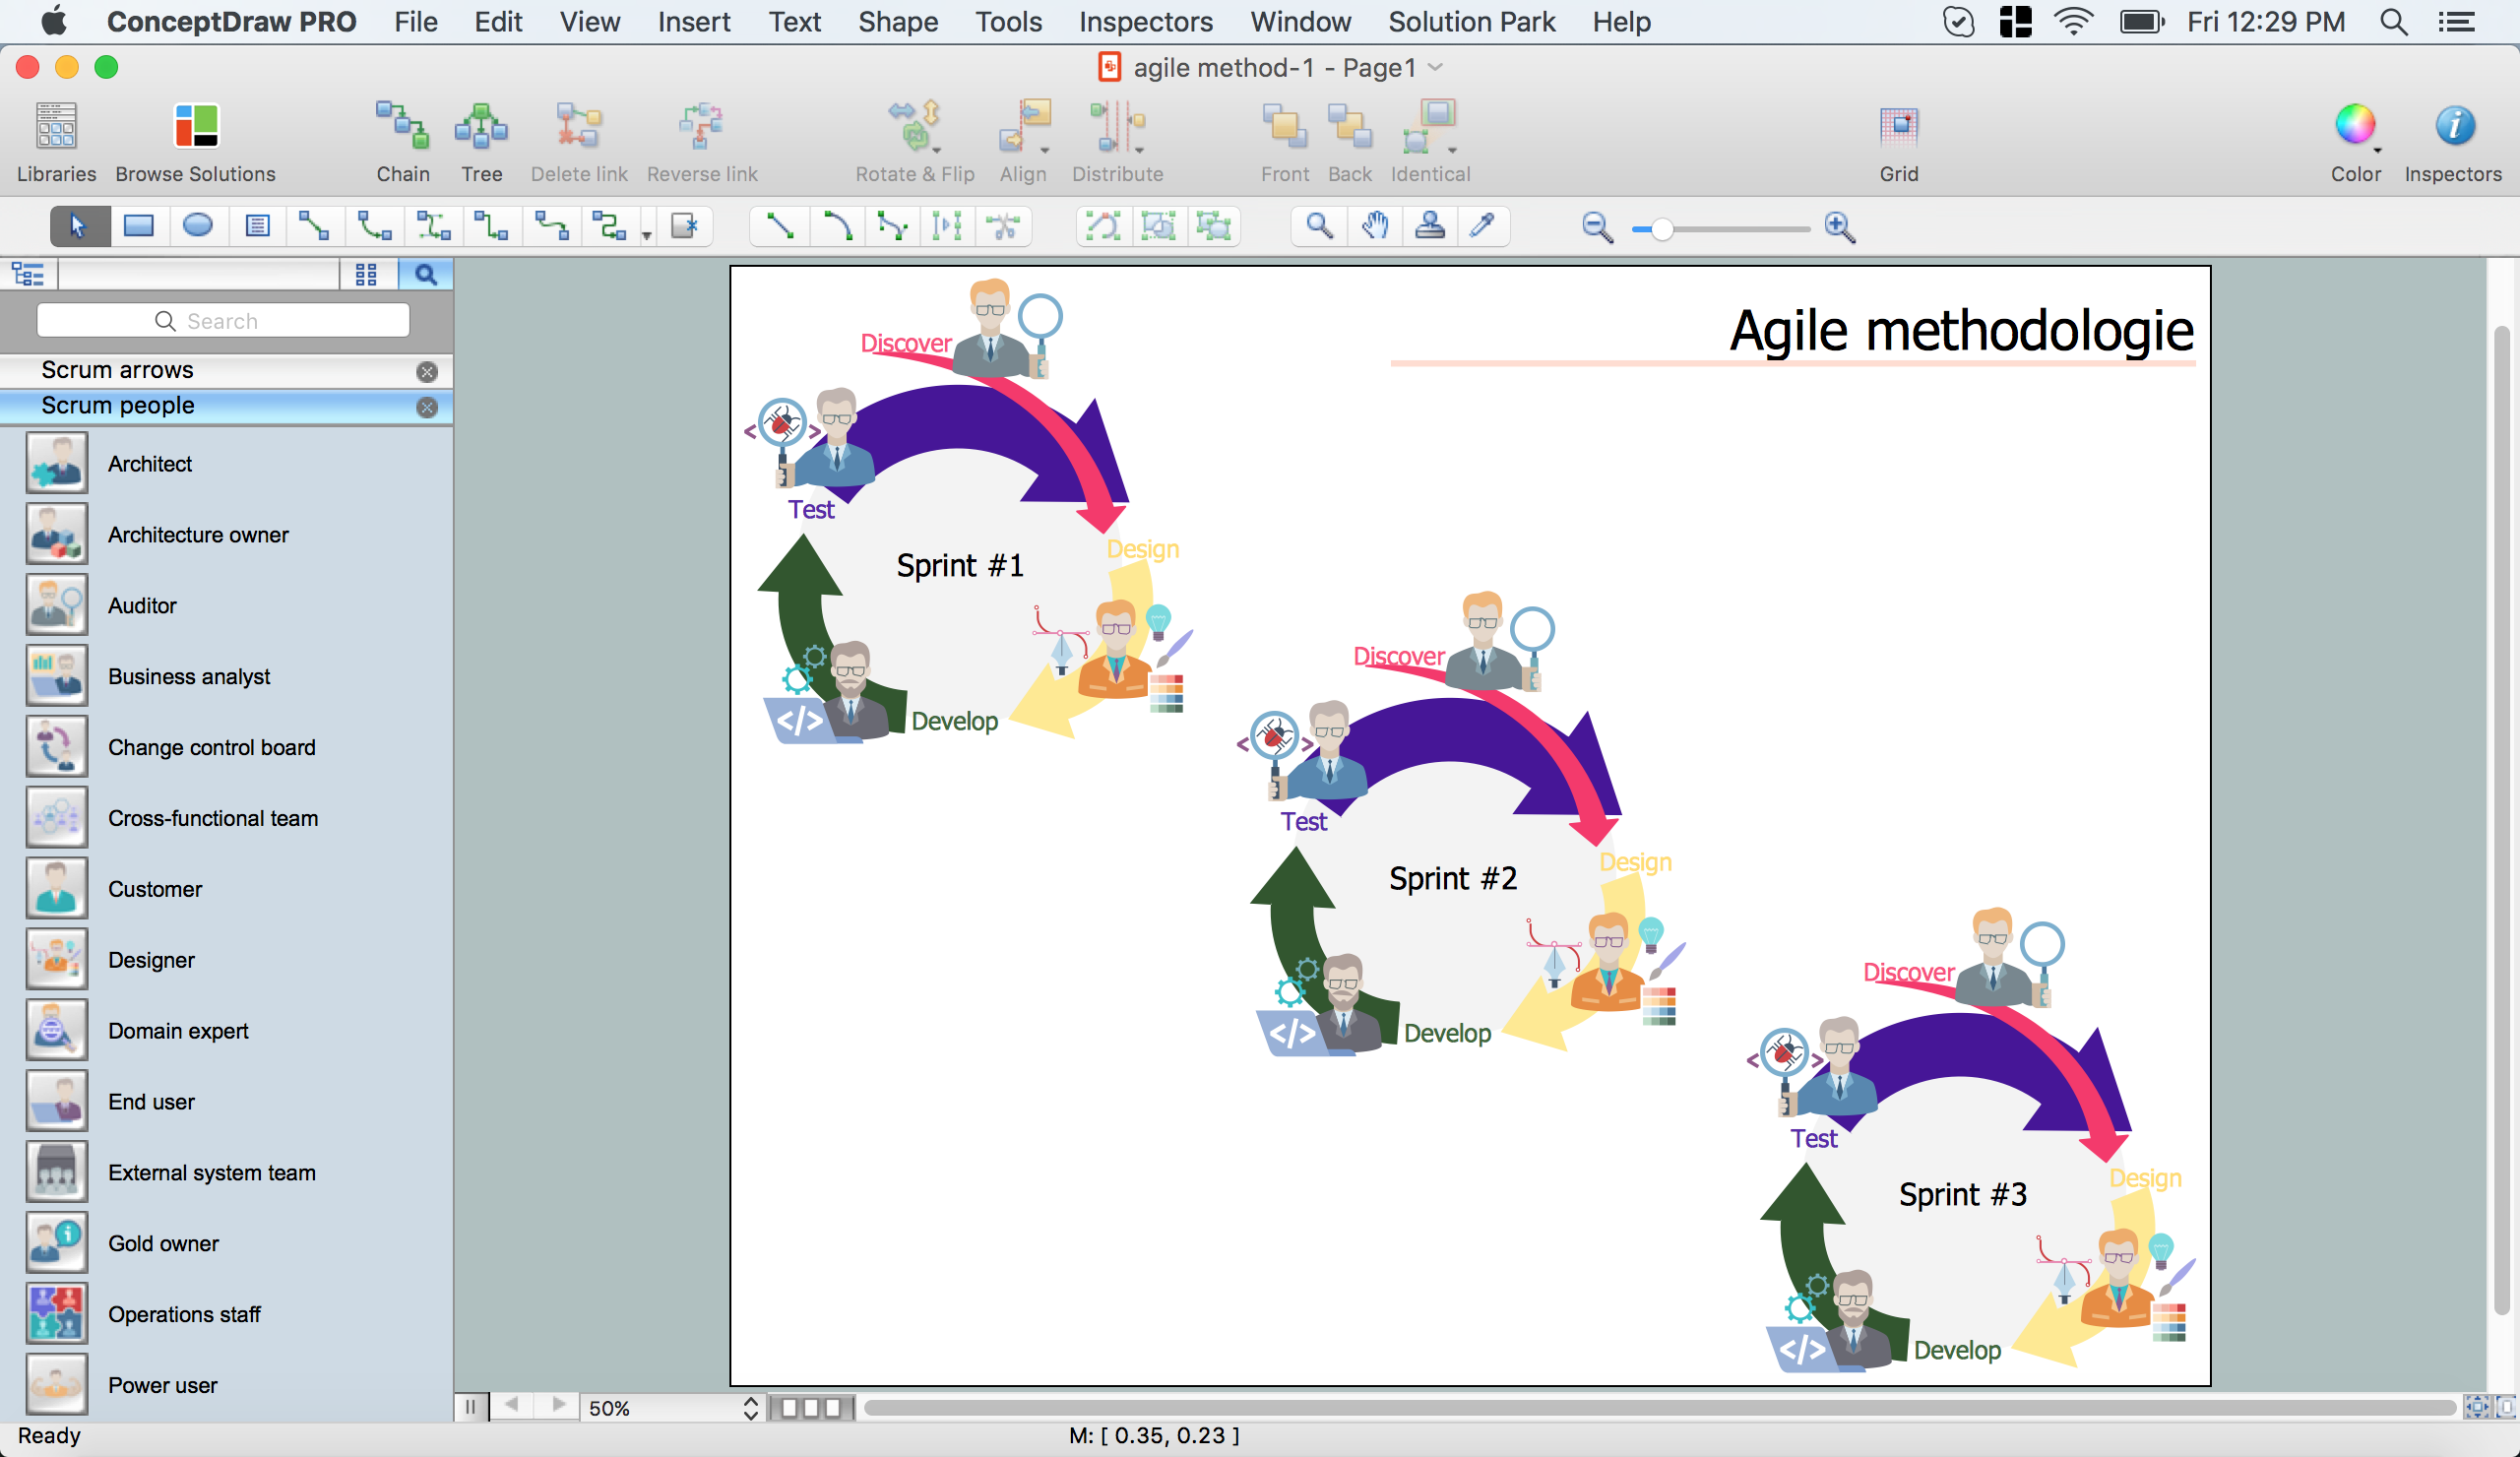
Example 4. Agile Methodology in ConceptDraw DIAGRAM /p>
This sample was created in ConceptDraw DIAGRAM software using the SCRUM Workflow Solution and illustrates Agile methodology. An experienced user spent 10 minutes creating this sample in ConceptDraw DIAGRAM
Use the tools of SCRUM Workflow Solution for ConceptDraw DIAGRAM to create your own professional looking diagrams, schemes, mind maps and infographics for Scrum and Agile related projects fast, easy and effective.
All source documents are vector graphic documents. They are available for reviewing, modifying, or converting to a variety of formats (PDF file, MS PowerPoint, MS Visio, and many other graphic formats) from the ConceptDraw STORE. The SCRUM Workflow Solution is available for all ConceptDraw DIAGRAM users.