Made with
ConceptDraw
DIAGRAM 18

Value stream with ConceptDraw DIAGRAM

The Value stream is a totality of all actions on the projection, order composition and production: starting from creation a product project to launching this product, from order to delivery, from extraction of raw materials to ready product manufacturing. Value stream mapping is a process of visualization of these actions and creation of a detailed and graphical map which will give the possibility to cover the whole consecution of actions at once, to study and analyze it. Value stream map unites all information and material flows therefore such diagram let you see and comprehend the flow of materials, resources and documents in the process of a product manufacturing. As a rule Value stream maps are created manually on a paper, but with the help of ConceptDraw library objects you can create such map more accurately and quickly.

Value stream method was developed and applied for the first time by Toyota company chief engineer in 80th of the last century as the new method of working out of wastes and for creation of more economical and competitive production. At the beginning this approach was head for the increase of productivity, which could help to discover shortages in relation to wastes and the quality of the system in general. Nevertheless this method is applied not only at work with the problem of wastes, but also with the problem of the low quality on the whole.

The goal of the Value stream mapping is to reduce the quantity of wastes in the system of the final product manufacturing. By this method wastes are defined as resources motion, which does not increase the value of the final product but wastes resources. This method can help managers, planners, engineers, suppliers and clients to discover points of wastes rise in the system, to define reasons of wastes rise, to reduce their quantity and thus to increase the effectiveness of work of the whole system.

In the process of Value stream map creation usually two schemes are created- of the current and future states. When the new state is achieved the scheme of the future state becomes the scheme of the current state and the next scheme of the future state is elaborated.

The constituents of stream in Value Stream Map may be materials (at products manufacturing), projects (at projection), clients’ needs (at service providing) and so on.

Wastes in the production system are divided into 7 categories:

Wastes connected with quality

  • Defects correction

Categories connected with human resources

  • Unplanned motions
  • Unplanned processes
  • Waiting

Categories connected with material resources

  • Unplanned materials transferring
  • Overproduction
  • Floats

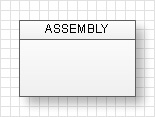
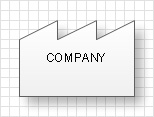
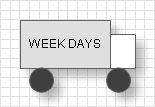
As soon as streams in Value Stream Map are divided into material and informational, objects of these streams are denoted by different images.

Material objects

Object Graphic representation
Manufacturing Process
Outside Sources
Data Box
Truck Shipment
Supermarket
Buffer or Safety Stock
Inventory
Finished Goods to Customer
First-In-First-Out Sequence Flow
Physical Pull/Withdrawal
PUSH Arrow

Informational objects
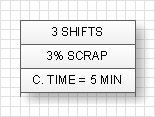
Object Graphic representation
Manual Information Flow
Electronic Information Flow
Signal Kanban
Load Leveling Box
Sequenced-Pull Ball
Withdrawal Kanban
Production Kanban
Kanban Post
Schedule
“Go See” Production Scheduling

General notations

Object Graphic representation
Kaizen Lightening Burst
Operator

Also the so-called Tact time is shown on the scheme, which is defined as the relation of the effective working time for one shift to needs of the customer for a shift. For example if the tact time is 5 minutes so every 5 minutes the ready product will be manufactured on the production line or one client will be served, and so on.

You can see below an example of Value Stream Map (Current State scheme).

Value stream with ConceptDraw DIAGRAM  *
TEN RELATED HOW TO's:
The ConceptDraw DIAGRAM is a good flow chart app for Mac. Numerous vector stencils, samples and templates created by designers allows you to draw any type of flowchart.Good Flow Chart app for Mac *
Picture: Good Flow Chart app for Mac
Related Solution:
This sample was created in ConceptDraw DIAGRAM diagramming and vector drawing software using the Cross-Functional Flowcharts solution from the Business Processes area of ConceptDraw Solution Park. This sample shows the Swim Lanes Flowchart of Identification and logging.Swim Lanes Flowchart. <br>Flowchart Examples *
Picture: Swim Lanes Flowchart. Flowchart Examples
Related Solution:
This diagram represents the electrical floor plan. This is a common practice - to draw the electrical plan on the floor plan. The outlets, fixtures and other electrical equipment are depicted on the floor plan with special symbols. This drawing was created using the possibilities of ConceptDraw DIAGRAM as CAD software. Computer-aided design software is intended to replaces manual engineering drafting with an automated process. CAD software is used by engineers, architects, and others to make high-precision technical drawings and illustrations. CAD software allows technical specialists to develop, examine and manage various engineering projects. It is almost impossible nowadays to imagine mechanical engineering without digital technologies. Finding a suitable CAD software for creating mechanic diagram and electrical diagram architectural designs can take a lot of time and effort. However, with ConceptDraw DIAGRAM you can create any diagram that you want and later convert it to the most popular graphic formats like.vsdx,.png,.pptx etc.ConceptDraw DIAGRAM software for making mechanic and electrical diagrams for architectural design
Picture: CAD Drawing Software for Making Mechanic Diagram and Electrical Diagram Architectural Designs
Related Solution:
If your company is in chaos in clutter and no one understands their rights and responsibilities, maybe it's time to change that. One of the ways to put the company in order is to draw an organization chart that would reflect the structure and show the relationships among departments and positions. This is a very useful and easy to understand scheme. This is example of the one of the most typical kind of organizational chart. It depicts an organizational structure of the hierarchical type. Its construction is similarv to pyramid. The single main position on the top - in this case, the mayor's position followed by sub-levels of authority in his command. Each position in the pyramid reports only to his supervisor, and takes only a report of direct subordinates. Such scheme limits the number of communications. This organizational structure is effectively used in public organizations. Also it is suitable for any organization with the need for multiple levels of middle managers. The ability to create organizational charts of different types is supplied with ConceptDraw Ogrcharts solutions.How to Draw an Organization Chart *
Picture: How to Draw an Organizational Chart
Related Solution:
ConceptDraw Value Stream Maps visualize for a manufacturing plant the material and information flow required to deliver a product/service to customers.Purposes of a Value Stream Management Tool *
Picture: Purposes of a Value Stream Management Tool
Related Solution:
The Total Quality Management Diagram solution helps your organization visualize business and industrial processes. Create Total Quality Management diagrams for business process with ConceptDraw software.A Study of the Business Value<br> of Total Quality Management *
Picture: A Study of the Business Value of Total Quality Management
Related Solution:
A full-featured project management solution with all the necessary functions right at your fingertips. Generates an extensive variety of reports on project and task statuses. These videos provide a series of lessons that will enhance the understanding of all our users, from people just starting out with the software, through to expert users.Project — Working With Tasks *
Picture: Project — Working With Tasks
Create your own flow charts of purchasing business processes using the ConceptDraw DIAGRAM softwarePurchasing Flowchart - Purchase Order. Flowchart Examples
Picture:
Purchasing Flowchart - Purchase Order
Flowchart Examples
Related Solution:
It’s very convenient to explain the different tactics and positions using the visual drawings. ConceptDraw DIAGRAM software extended with the Soccer solution from the Sport area of ConceptDraw Solution Park provides libraries, templates and samples allowing specialists or soccer fans to draw the soccer-related diagrams and schemas of any complexity in a few minutes.Soccer (Football) Offside *
Picture: Soccer (Football) Offside
Related Solution:
When studying a business process or system involving the transfer of data, it is common to use a Data Flow Diagram (DFD) to visualize how data are processed. Being initially used exclusively in regards to the flow of data through a computer system, now DFDs are employed as the business modeling tools. They are applied to describe the business events and interactions, or physical systems involving data storage and transfer. ConceptDraw DIAGRAM is a powerful Data Flow Diagram software thanks to the Data Flow Diagrams solution from the Software Development area of ConceptDraw Solution Park.Data Flow Diagram Software *
Picture: Data Flow Diagram Software
Related Solution:
ConceptDraw
DIAGRAM 18