
Example 1. Property Management
This sample shows the Property Management matrix, the ideas are ordered in regards to importance and frequency. This matrix gives the ability to turn the theory into quantifiable data.
“Property management is the operation, control, and oversight of real estate as used in its most broad terms. Management indicates a need to be cared for, monitored and accountability given for its useful life and condition. This is much akin to the role of management in any business.”
[from Wikipedia]
Using the objects from the libraries of the Seven Management and Planning Tools Solution for ConceptDraw DIAGRAM you can create your own professional Business Diagrams quick and easy.
The diagrams produced with ConceptDraw DIAGRAM are vector graphic documents and are available for reviewing, modifying, and converting to a variety of formats (image, HTML, PDF file, MS PowerPoint Presentation, Adobe Flash or MS Visio).
See also Samples:
TEN RELATED HOW TO's:
The use case diagram (behavior scenarios, precedents) is the initial conceptual representation of the system during its design and development. This diagram consists of actors, use cases and relationships between them. When constructing a diagram, common notation elements can also be used: notes and extension mechanisms.
This sample was created in ConceptDraw DIAGRAM diagramming and vector drawing software using the UML Use Case Diagram library of the Rapid UML Solution from the Software Development area of ConceptDraw Solution Park.
This sample shows the types of user’s interactions with the system and is used at the registration and working with the database system.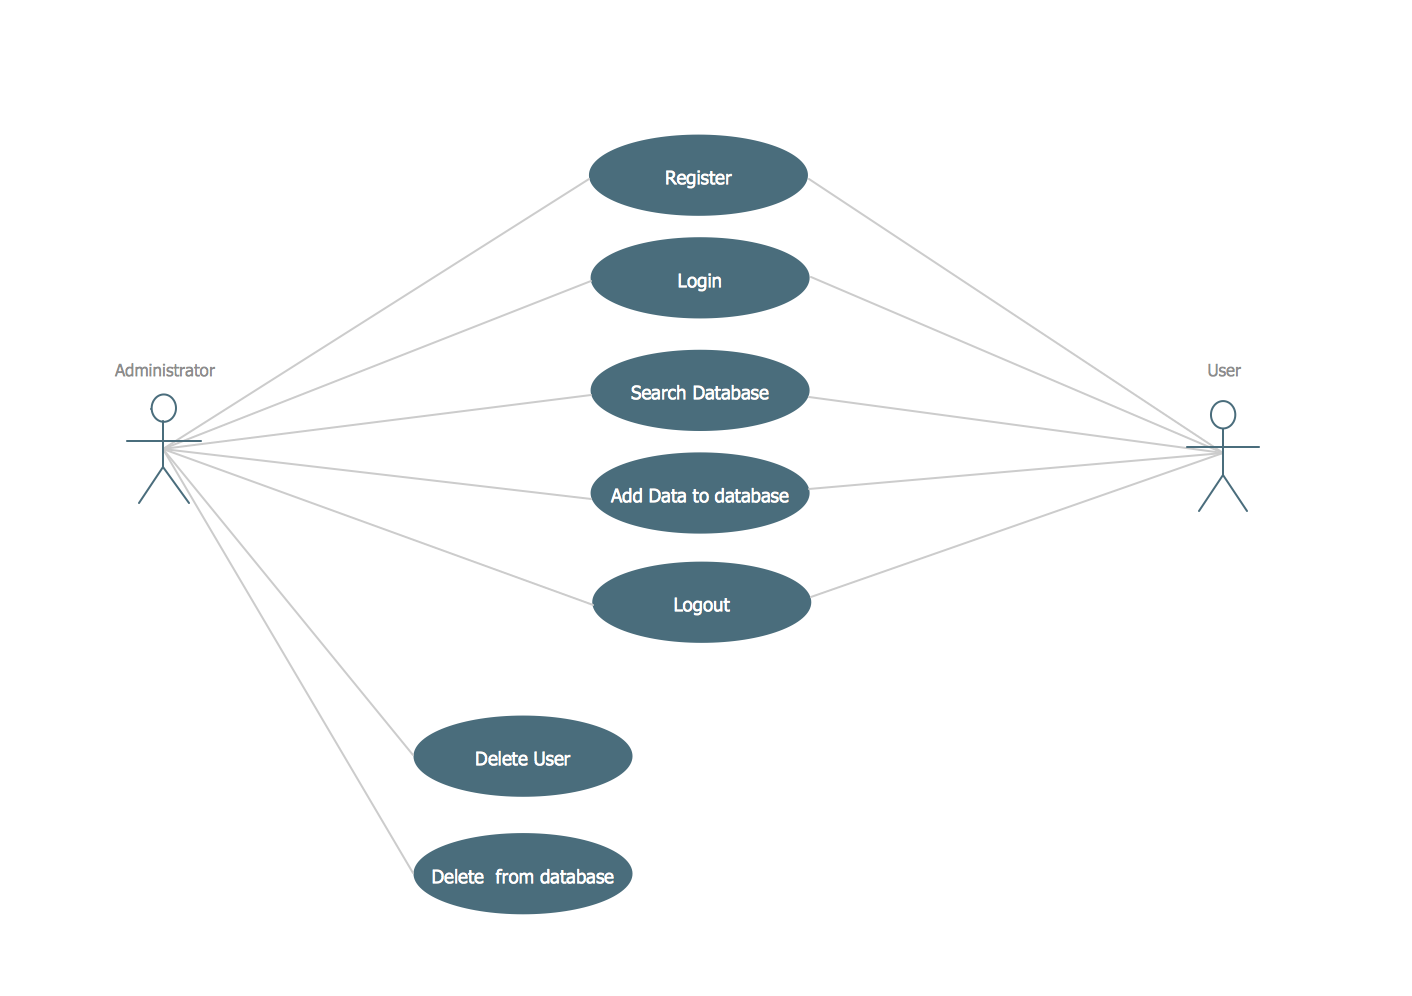
Picture: UML Use Case Diagram Example. Registration System
Related Solution:
ConceptDraw is your tool for driving social integration and managing change across and streamline social media processes of your organisation.This tool keeps the entire team on the same page allowing you to realize your social media strategy, improve the quality of your answers, and minimize the time it takes to respond.
Picture: Social Media Response Management DFD Charts - software tools
Related Solution:
UML Component Diagram Online Shopping. This sample was created in ConceptDraw DIAGRAM diagramming and vector drawing software using the UML Component Diagram library of the Rapid UML Solution from the Software Development area of ConceptDraw Solution Park.
This sample shows the concept of the online shopping and is used for the understanding of the online shopping processes, of the online shops working processes, for projection and creating of the online stores.
Picture: UML Component Diagram Example - Online Shopping
Related Solution:
UML Use Case Diagram Taxi Service - This sample was created in ConceptDraw DIAGRAM diagramming and vector drawing software using the UML Use Case Diagram library of the Rapid UML Solution from the Software Development area of ConceptDraw Solution Park.
This sample shows the work of the taxi service and is used by taxi stations, by airports, in the tourism field and delivery service.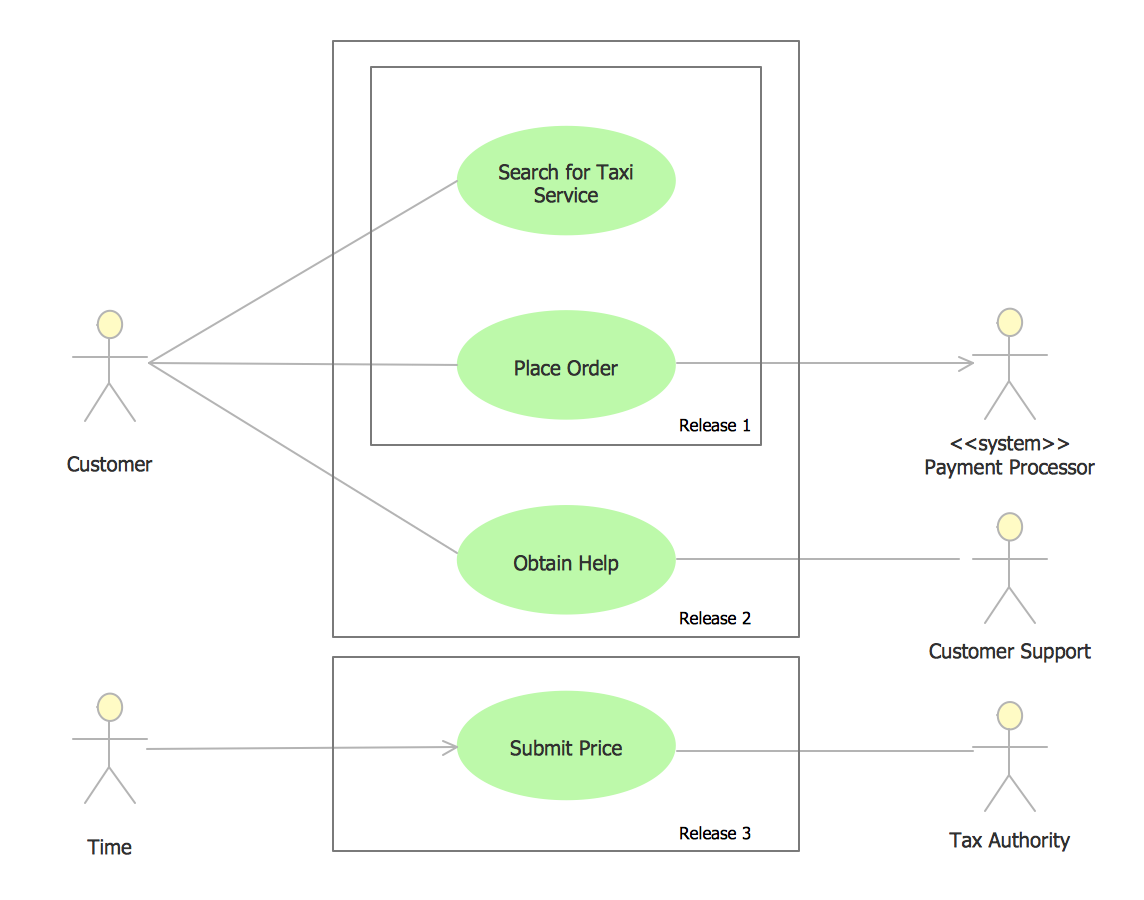
Picture: UML Use Case Diagram Example - Taxi Service
Related Solution:
Automatically create a presentation-quality diagram in one click with ConceptDraw DIAGRAM.
Picture: Visual Presentations Made Easy with Diagramming Software
Related Solution:
UML Deployment Diagram depicts the physical deployment of artifacts on nodes (nodes are the existing hardware components, artifacts are the software components running on each node); and how the different pieces are connected.
Use ConceptDraw DIAGRAM with UML deployment diagram templates, samples and stencil library from Rapid UML solution to model the physical deployment of artifacts on nodes of your software system.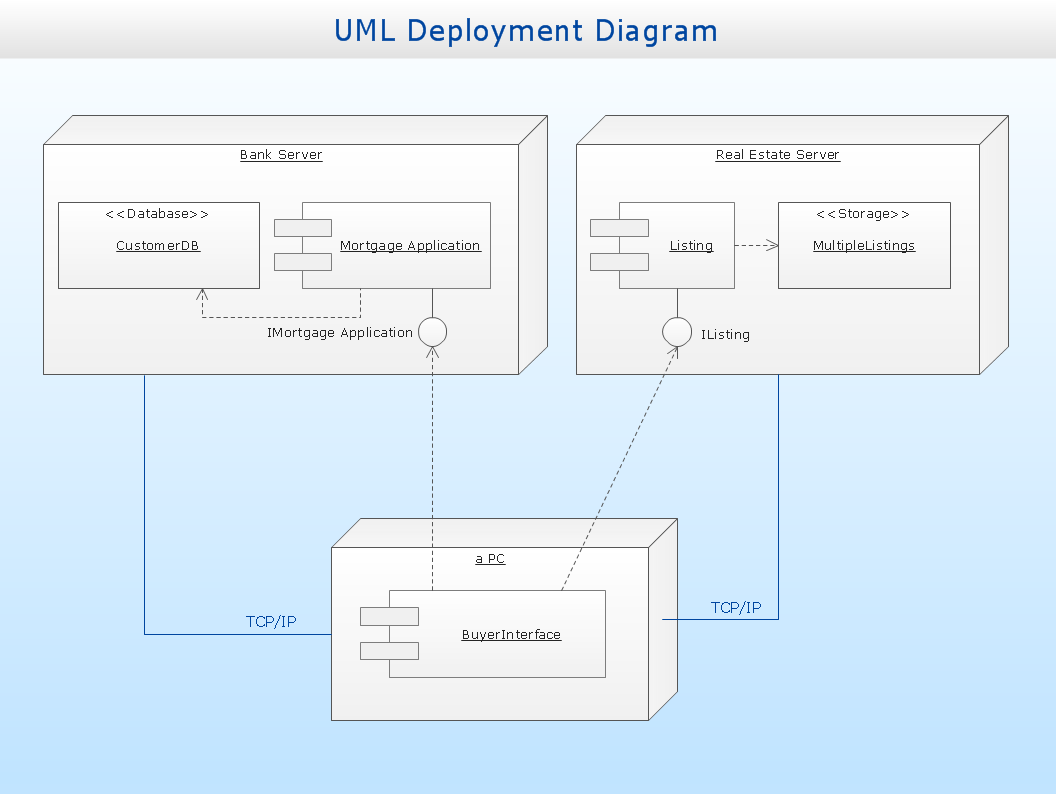
Picture: UML Deployment Diagram
Related Solution:
ORM diagrams are a straightforward and incredibly effective way to explore domain concepts with your stakeholders.
Picture: ORM Diagram
The Sales Process is a complex approach for selling a product or service which assumes many steps including the sales planning, realization of the sales marketing and management strategies, sales process analysis, etc. Now we have a ConceptDraw DIAGRAM software extended with unique Sales Flowcharts solution from the Marketing area of ConceptDraw Solution Park which ideally suits for the planning and realization the company's sales process.
Picture: The Sales Process
Related Solution:
ConceptDraw DIAGRAM is a powerful software for creating professional looking Flowcharts quick and easy.
Picture:
Flowchart
What is Flowchart
Related Solution:
Meeting ice hockey rules one should learn ice hockey rink terms, lines, zones etc. ConceptDraw DIAGRAM is an advanced drawing software that allows you produce ice hockey rink depiction of any complexity, from simple sketch drawing to detailed one as on example below.
Picture: Ice Hockey Rink Dimensions
Related Solution: