Export from ConceptDraw MINDMAP
to PDF (Adobe Acrobat®) File
|
The export options in ConceptDraw MINDMAP allow mind maps to be exported in various graphical formats such as images, webpages, or PDF files. They can also be exported into Microsoft Office applications or into different mindmapping programs. So there would be no difficulties to share your ideas with other people. |
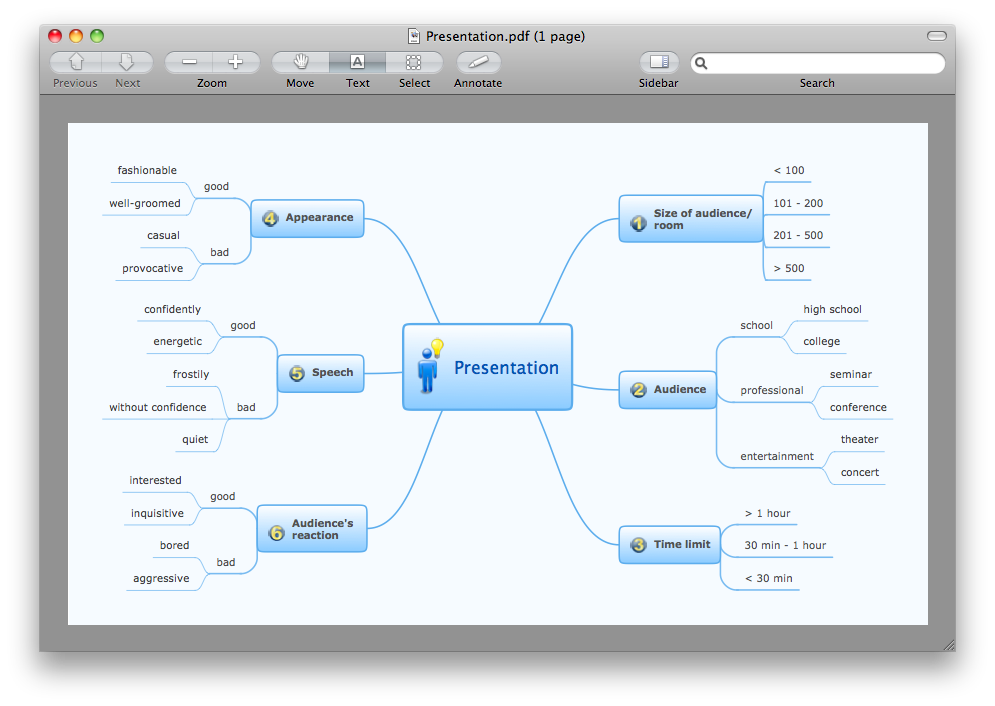
Pic. 1. A PDF-file exported from ConceptDraw MINDMAP
There is no special settings in ConceptDraw MINDMAP required for this export, so you can create a PDF file from your document within a seconds.
See also Samples of mind maps:
- Mind Maps
- Mind Maps — Marketing
- Mind Maps — Idea Communication
- Mind Maps — Mind Map Exchange
-
Mind Maps — Presentation Exchange
TEN RELATED HOW TO's:Fishbone diagrams work for most entrepreneurs and almost any industry or person having a problem. Professional diagramming software may help you create Fishbone (Cause and Effect or Ishikawa) diagrams. When people are unclear about what is causing an issue, ConceptDraw DIAGRAM will be your lifesaver. When to use a Fishbone diagram? Originally developed as a quality control tool, you may find a Fishbone diagram helpful when used in many cases, such as to analyze a complex problem when there are many causes, for identifying all possible root causes for an effect or a problem, when you need different point of view to look on a problem, to uncover bottlenecks and identify where and why a process doesn't work, for acceleration a process when traditional ways of problem solving consume many time. Picture: When To Use a Fishbone DiagramRelated Solution:Architectural drawing allows to show the location of a building or ensemble of buildings on the ground, indicating the cardinal points. For centuries, people had been studying architecture in universities to learn how to draw building plans and now everyone can do it easily just using appropriate software. While developing the building plan, its graphic part, you can display the part of the floor or the entire floor of a building with an indication of the exact location of the drawn premise. Small-sized apartments does not restrict the advanced interior design opportunities. Here is a detailed and precise floor plan of a pretty small apartment. A furniture objects are added to show possible interior of this home. This plan can be used to help somebody with a floor layout and furniture arrangement. Having this floor plan in a pocket while shopping would be useful to check if there is enough rooms for a new furniture.
 Picture: How To Draw Building PlansRelated Solution:Developing a software project supposes architecture first. To make it proper, you can use data flow diagram model in your current project. The data flow diagram represents the Model of small traditional production enterprise that is made using Yourdon and Coad notation. It shows how the data is transfered through a process. According to the notation of Yourdon and Coad a process is represented by circles and data stores are drawn using parallel lines. This DFD was created using the ConceptDraw Data Flow Diagrams solution. Using this solution one can visualize data flow accordingly to the rules of two basic notations used for data flow modeling.
 Picture: Data Flow Diagram ModelRelated Solution:The best way to visualize the introduction to Cloud computing architecture is to create diagrams and schematics representing what is a cloud computing and how it works. For their design, we recommend to use a powerful ConceptDraw DIAGRAM diagramming and vector drawing software supplied with Cloud Computing Diagrams solution from the Computers and Network area of ConceptDraw Solution Park
 Picture: Introduction to Cloud Computing ArchitectureRelated Solution:This method of problem analysis is widely used in IT, manufacture industries and chemical engineering. If you want to take a fresh look on your problem, you can draw a fishbone diagram with ConceptDraw DIAGRAM software, which supports both MAC OS and Windows. You can see and download fishbone diagram samples and templates in ConceptDraw Solution Park. This Fishbone (Ishikawa) diagram can be applied as template for performing the cause and effect analysis of a service industry problems. It can help to determine factors causing problems. Causes in this diagram are categorized according to the 4S’s principle that means Surroundings, Suppliers, Systems and Skills. Grouping causes allows to reveal main interactions between different events. This diagram was made using ConceptDraw Fishbone diagrams solution. It can help to reveal the causes effected a complicated issue. Of course it can be used together with other methods of approaching to the problem solving.
 Picture: Draw Fishbone Diagram on MAC SoftwareRelated Solution:Use the Relations Diagram to create a relations factors map and to identify which factors are “drivers” and “indicators”. This diagram identifies causal relationships and determine what factors are causes or effects. ConceptDraw OFFICE suite is a software for relation diagram making.
 Picture: PROBLEM ANALYSIS.Relations DiagramHow to Draw ER Diagrams? With Entity-Relationship Diagram (ERD) solution from the Software Development Area for ConceptDraw Solution Park you are able to draw ER diagram with no problem. It includes 45 predesigned icons advocated by popular Chen's and Crow’s Foot notations that can be used when describing an enterprise database.
 Picture: How to Draw ER DiagramsRelated Solution:ConceptDraw DIAGRAM diagramming and vector drawing software extended with unique SCRUM Workflow solution from the Project Management area of ConceptDraw Solution Park allows fast and easy design professional-looking Scrum Workflow Diagrams and Scrum workflow scheme for projects required when working on projects and managing them, when developing software with cutting-edge Agile methodologies.
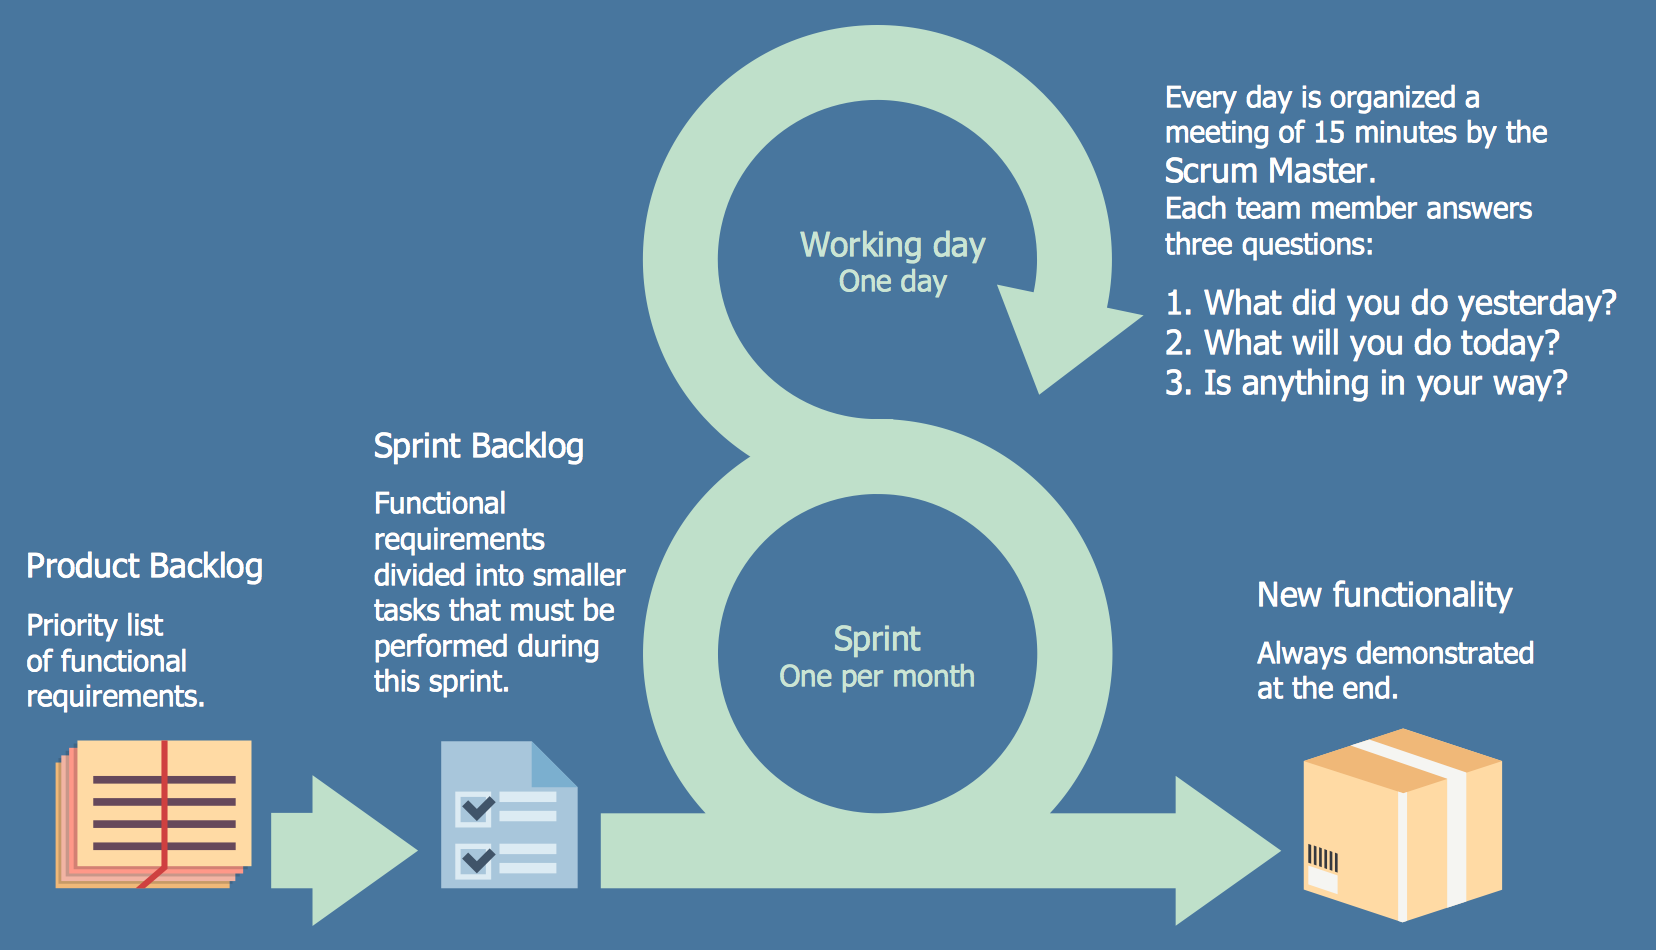 Picture: Scrum workflowRelated Solution:Choose which of business design elements you love best. Design your own style with Business and Finance Solutions from ConceptDraw DIAGRAM. We created a full set of elements, business samples, templates and libraries with vector clip art for drawing the Business Illustrations. Mark your report or presentation, pay an attention of audience on your drawings with vector business design elements.
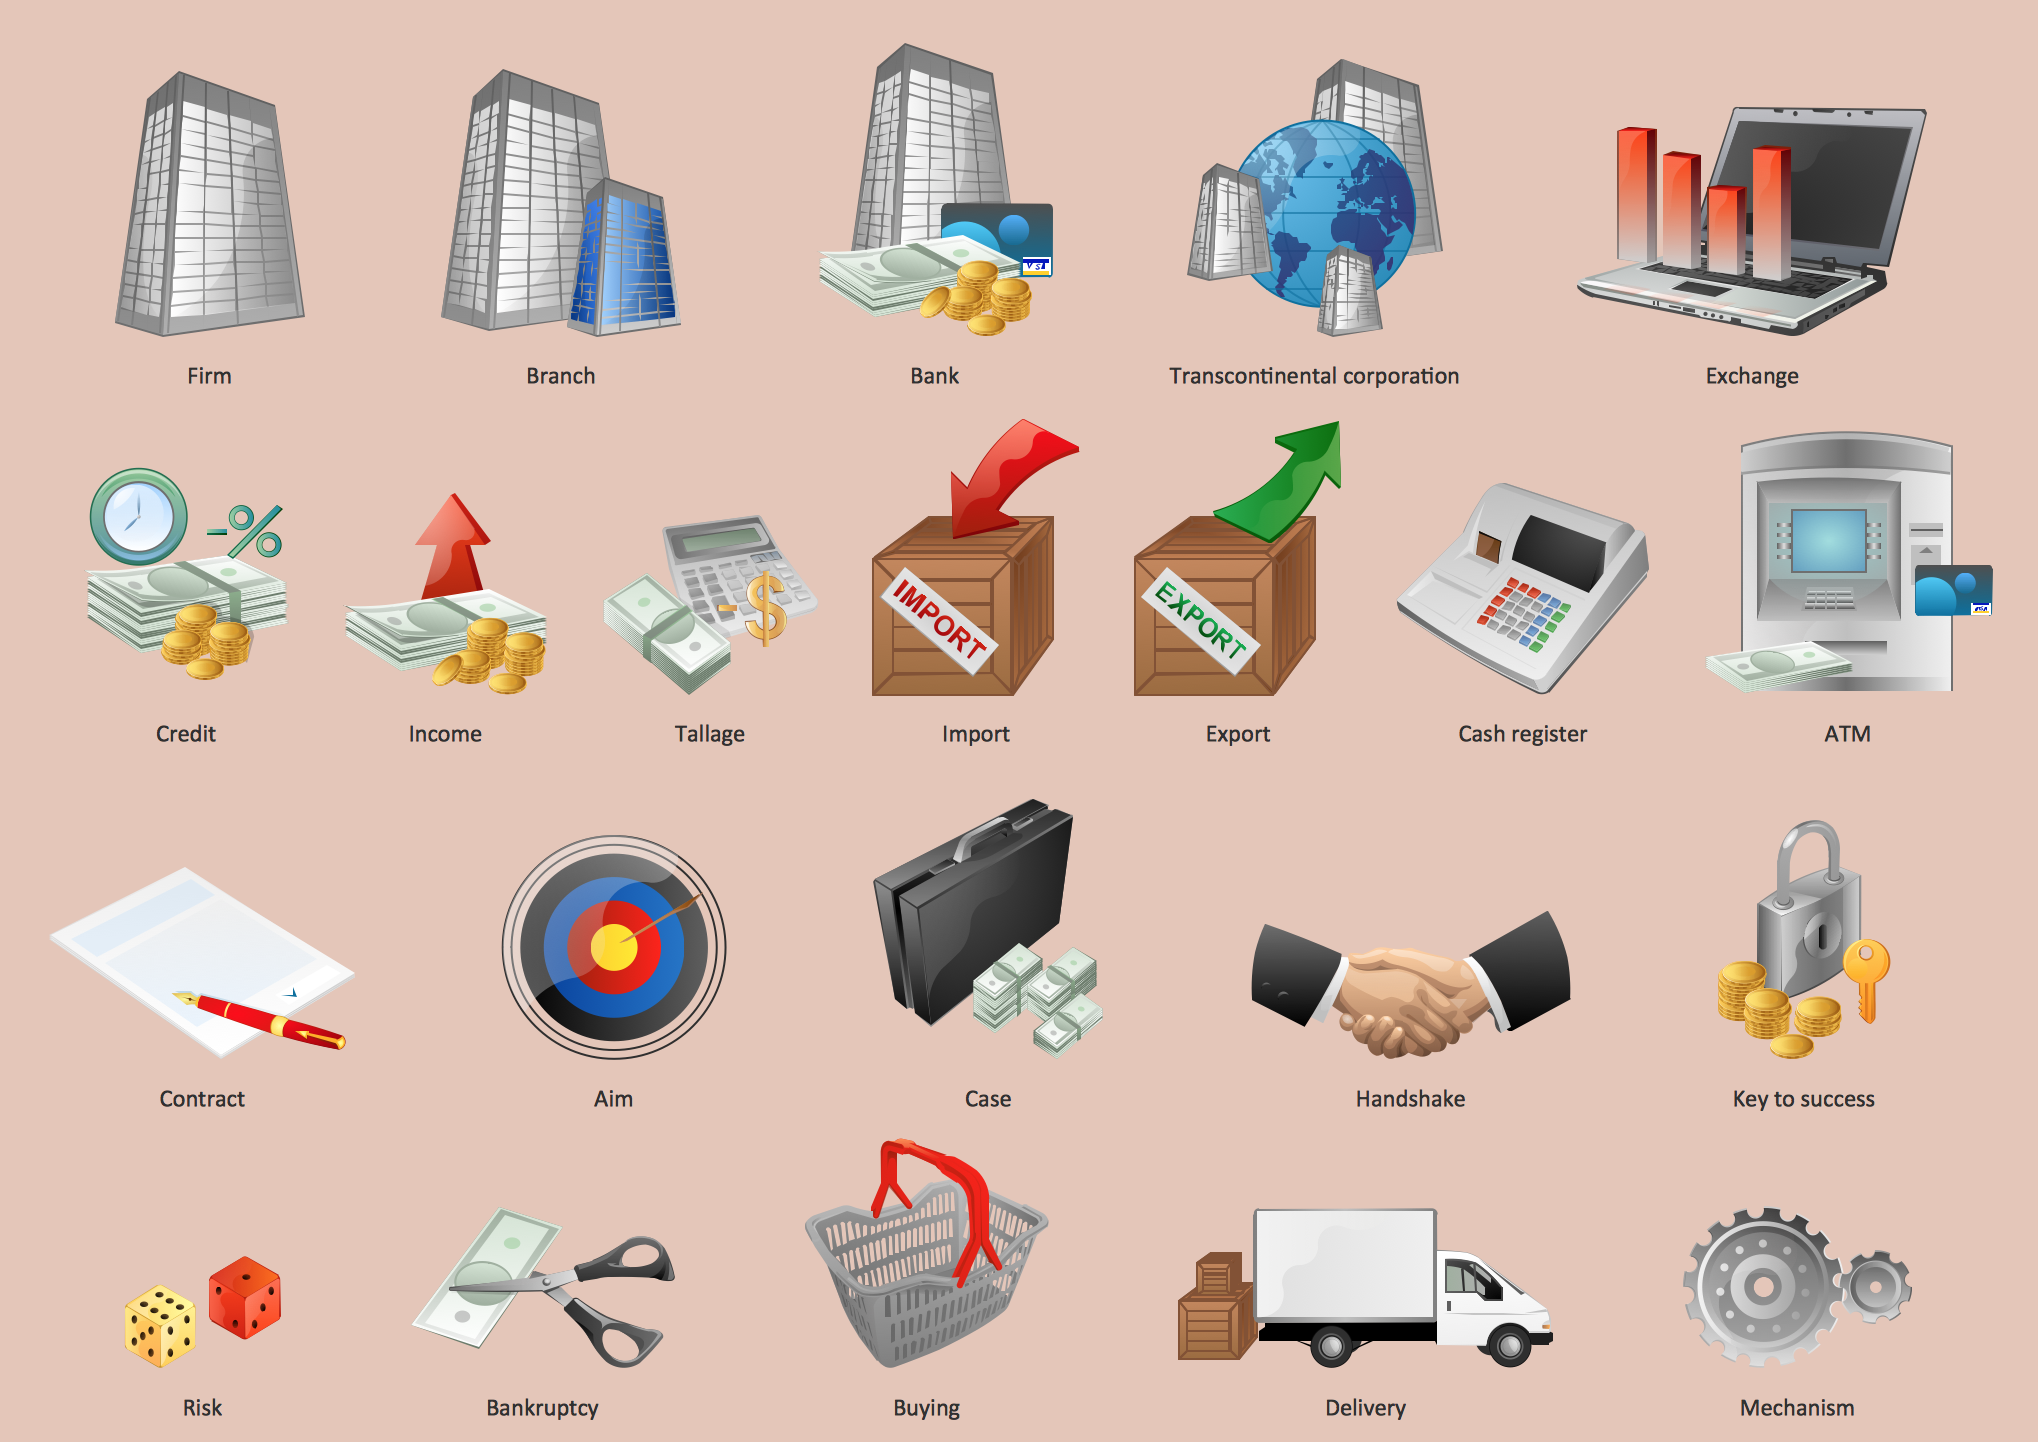 Picture: Business - Design ElementsRelated Solution:The Building Plans are very useful and even necessary for architects, builders, designers and simple for those who want to build the home, office, flat or anyone other building. They are also convenient for those who want to design or redesign the home, flat, room, etc.
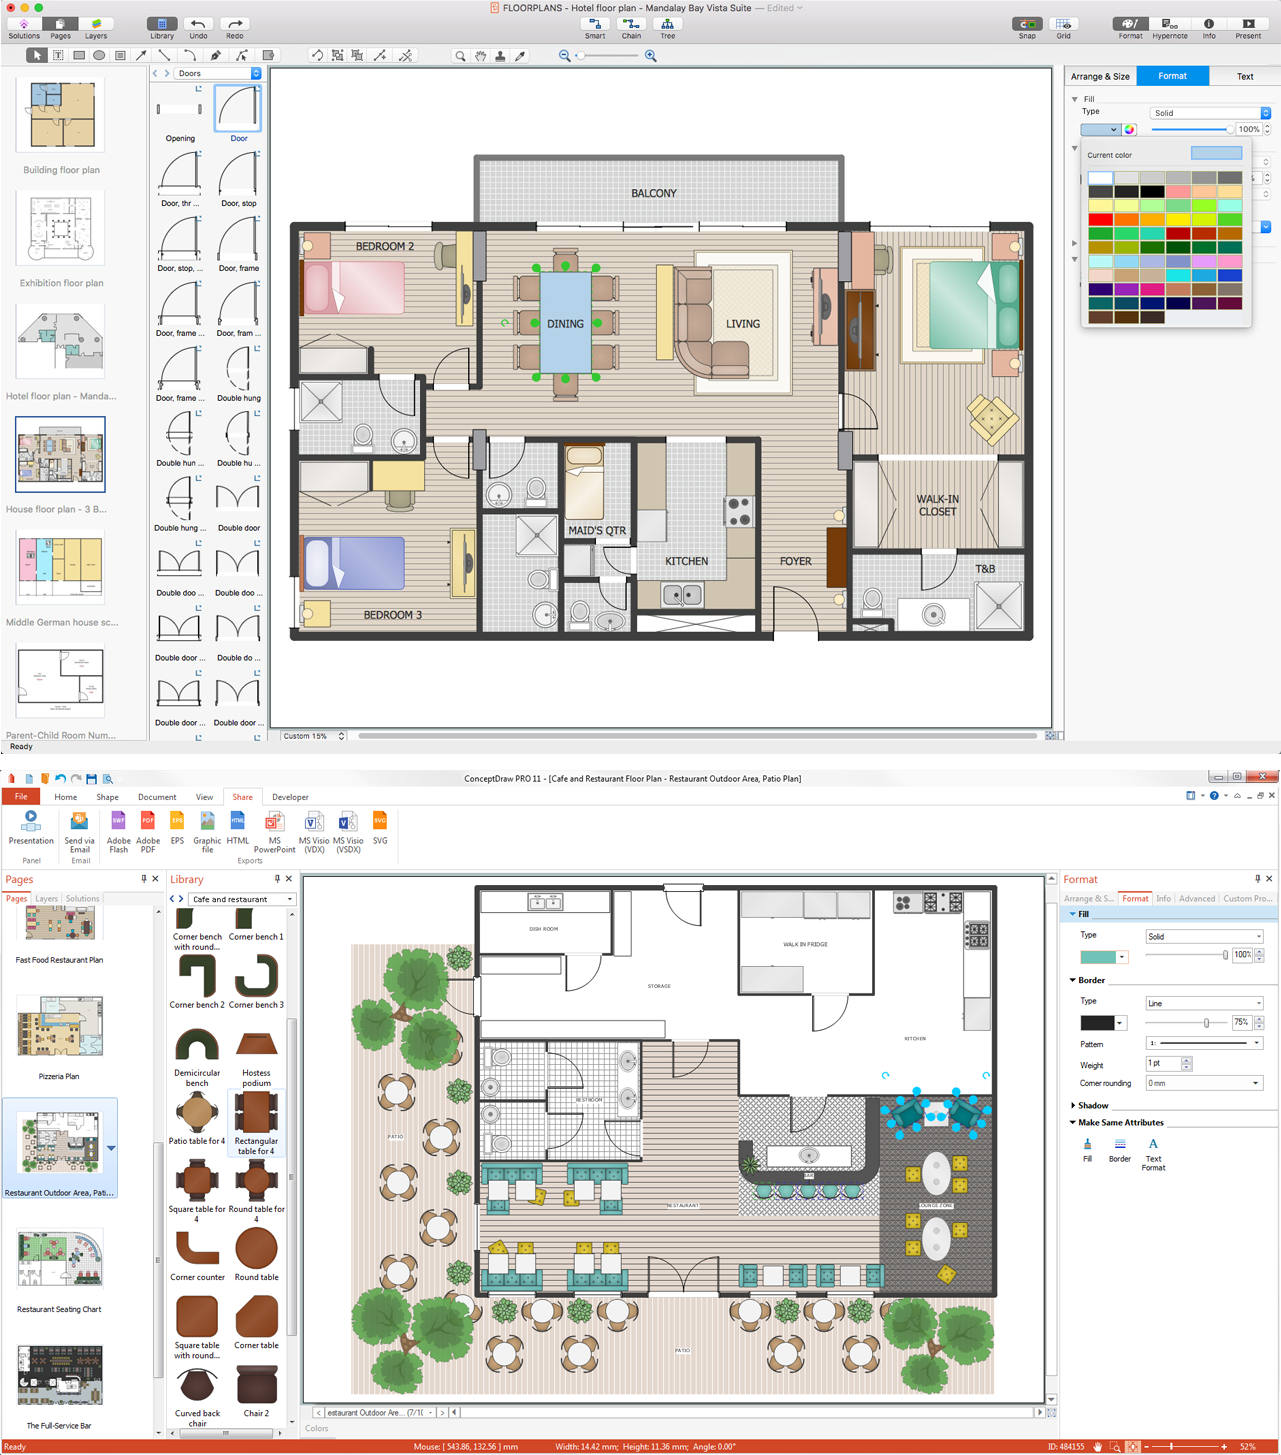 Picture: Building Plan Software. Building Plan ExamplesRelated Solution:ConceptDrawMINDMAP 16