Example 1. Diagram of a Pyramid - DNA model of seduction
With useful tools of Pyramid Diagrams Solution you can easily create a pyramid with any quantity of levels. The Pyramid Diagrams library from the Pyramid Diagrams Solution contains 28 predesigned vector objects for drawing a diagram of a pyramid of any type and style.

Example 2. Diagram of a Pyramid - Ecosystem goods and services
Pay also your attention for the extremely large collection of predesigned samples and templates. All they are available for viewing and editing from ConceptDraw STORE. Don't miss your chance to take advantage of them.

Example 3. Diagram of a Pyramid - Global liquidity inverted pyramid
The samples you see on this page were created in ConceptDraw DIAGRAM software using the Pyramid Diagrams Solution. Each diagram of a pyramid represented here successfully demonstrates solution's capabilities and professional results you can achieve. An experienced user spent 5 minutes creating every of these samples.
Use the Pyramid Diagrams Solution for ConceptDraw DIAGRAM software to create your own professional looking 2D and 3D pyramid diagrams quick, easy and effective, and then successfully use them in your life and work activity.
All source documents are vector graphic documents. They are available for reviewing, modifying, or converting to a variety of formats (PDF file, MS PowerPoint, MS Visio, and many other graphic formats) from the ConceptDraw STORE. The Pyramid Diagrams Solution is available for all ConceptDraw DIAGRAM or later users.
SIX RELATED HOW TO's:
When thinking about the process of decision making, it's easy to imagine it as a pyramid. We will look at a three level pyramid model as an example. Operational decisions are first that come to mind, and it's the first level. Tactical and strategic decisions are the second and the third levels.
Pyramid (triangle) diagrams are used to show some hierarchical data. Because to the pyramid form of diagram, each diagram slice has a different width. The width of each segment depends on its hierarchical level.
The current image illustrates the model of information system types. Most graphically the model can be represented as a three level pyramid. The first level shows a system of transaction processing It is concentrated on operational tasks. The second level is devoted to tactical solutions of the information system management. And at least, the third level addresses strategy and represents the executive information system. This three level pyramid sample is supplied with the ConceptDraw Pyramid Diagrams solution from Marketing area of ConceptDraw Solution Park.
Picture: Pyramid Diagram
Related Solutions:
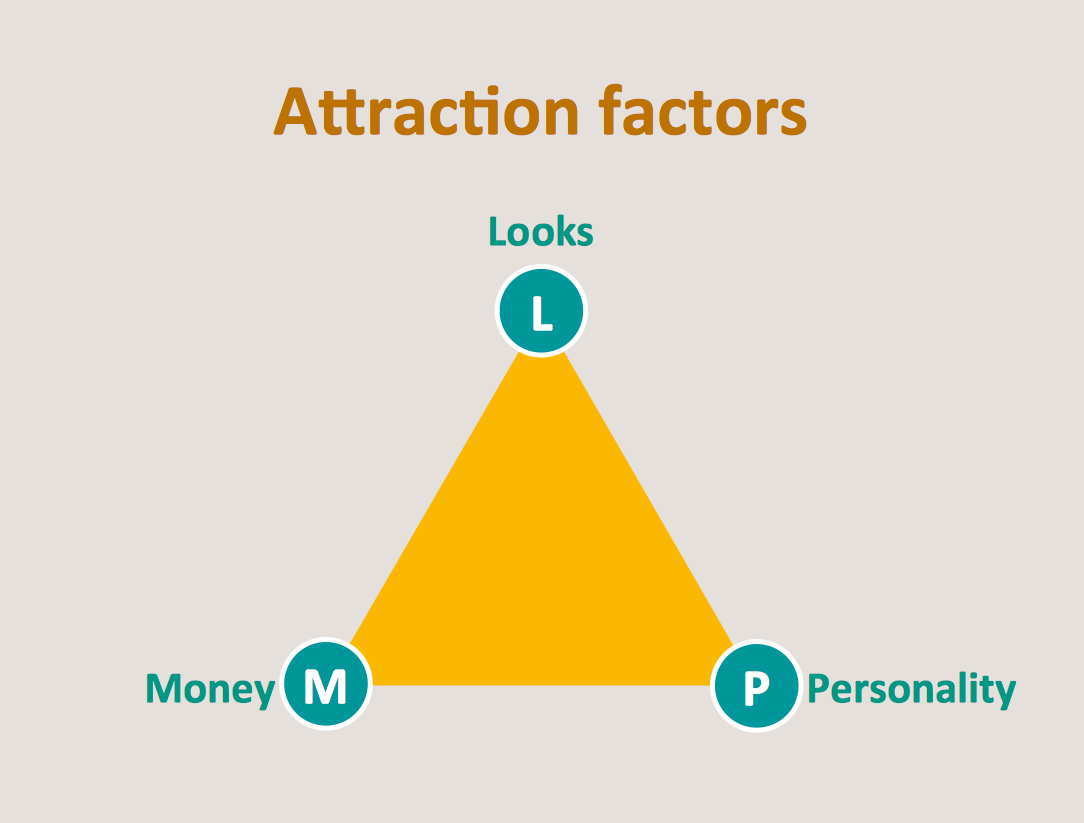
The Time-Money-Quality Triangle illustrates an advertising truism, that you can't have all three.
Picture: Pyramid Diagram
Related Solutions:
In software engineering, it is important to understand how the system would cooperate with external sources, like data sources. To give this information a visual representation, data flow diagrams (DFD) were used for years. The entire system is usually divided into smaller ones, and all of them process data flows in appropriate ways.
The visualizing business processes which engages the data transfer, is commonly preformed using DFDs (data flow diagrams). DFD is used to show the data flow processing and transformation. This DFD represents the electronic system of a customer purchase. It was created using Gane/Sarson notation. Data flow diagrams helps you to sort through and clarify transferring process making it available for analysis, and representation. ConceptDraw DFD solution introduces the vector library, containing the full set of icons from DFD notations.
Picture: Data Flow Diagram (DFD)
Related Solution:
Competitor analysis is a first and obligatory step in elaboration the proper corporate marketing strategy and creating sustainable competitive advantage. Use powerful opportunities of numerous solutions from ConceptDraw Solution Park for designing illustrative diagrams, charts, matrices which are necessary for effective competitor analysis.
Picture: Competitor Analysis
Related Solution:
Nicaragua, officially the Republic of Nicaragua, is the largest country in the Central American isthmus, bordering Honduras to the north and Costa Rica to the south.
The vector stencils library Nicaragua contains contours for ConceptDraw DIAGRAM diagramming and vector drawing software. This library is contained in the Continent Maps solution from Maps area of ConceptDraw Solution Park.
Picture: Geo Map - South America - Nicaragua
Related Solution:
Planning a computer network can be a challenge for a junior specialist. However, knowing how to draw a computer network diagrams isn’t a rocket science anymore. There are a lot of special software for creating such diagrams with predesigned templates and examples.
The core for Network Fault Tolerance System presented here, is the equipment of Cisco. You can see here the certified Cisco equipment icons. Generally, ConceptDraw DIAGRAM libraries contain more than half of a thousand objects representing the standardized images of Cisco equipment. ConceptDraw solution for network diagramming is a great network diagramming tool for any level skills - from students to network guru.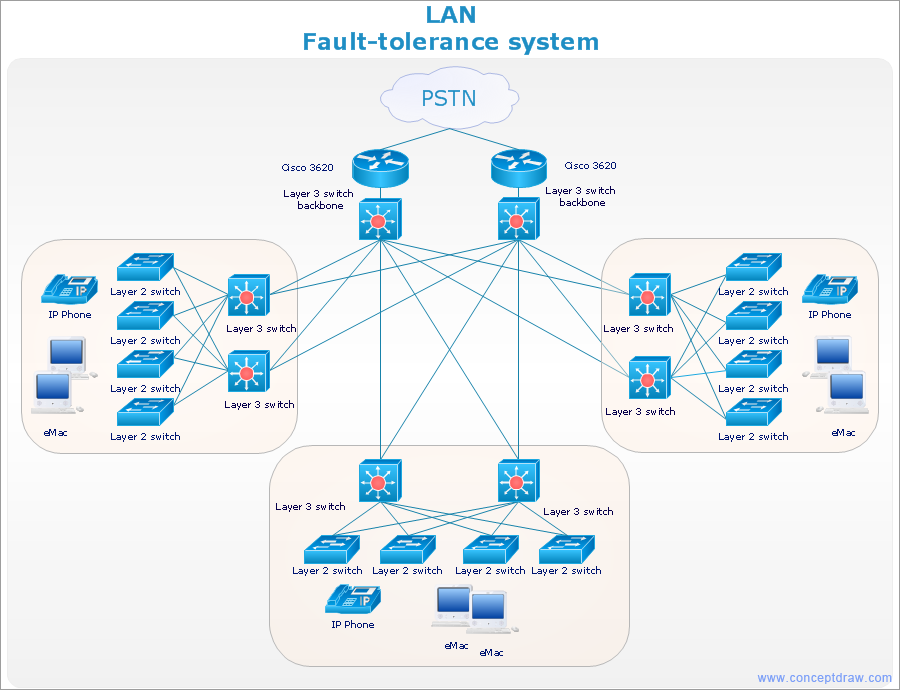
Picture: How to Draw a Computer Network Diagrams
Related Solution:

