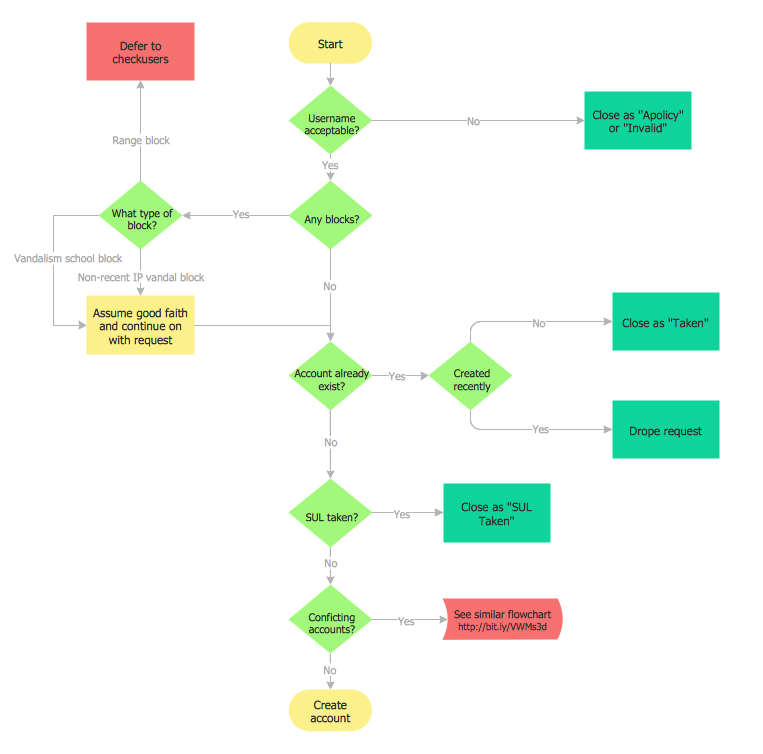
This sample shows the Flowchart of the ACC general account creation. This Flowchart describes the Start point, the process of the handling the user requests and the End point – creating of the account. The shapes represent the subprocesses and the arrows between the shapes shows the sequence of the actions.
Using the ready-to-use predesigned objects, samples and templates from the Flowcharts Solution for ConceptDraw DIAGRAM you can create your own professional looking Flowchart Diagrams quick and easy.
The Flowcharts produced with ConceptDraw DIAGRAM are vector graphic documents and are available for reviewing, modifying, and converting to a variety of formats (image, HTML, PDF file, MS PowerPoint Presentation, Adobe Flash or MS Visio).
TEN RELATED HOW TO's:
Comparing ConceptDraw DIAGRAM to Omnigraffle - Cross-platform product. While most drawing tools are designed for use on one operating system, ConceptDraw DIAGRAM is available as two independent and concurrent versions on both Macintosh (macOS) and PC (Windows).
License is per named user. That means you can use a single license for Macintosh and PC. Users can install at work and at home with a single license.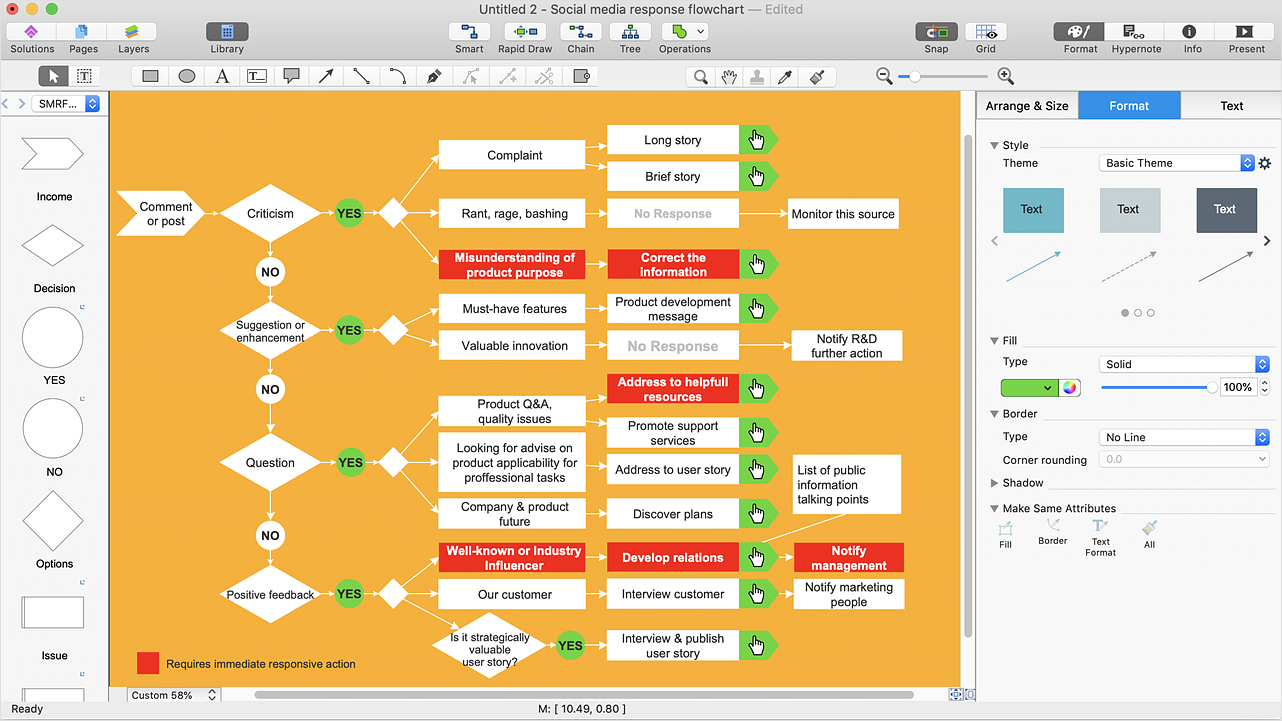
Picture: Comparing ConceptDraw DIAGRAM to Omnigraffle
Related Solution:
In any unclear situation create a workflow diagram. Workflow diagrams help to understand processes, find bottlenecks and fix the process. When you create workflow diagram using ConceptDraw DIAGRAM software you are able to focus on thinking, not drawing, that makes you as effective as possible.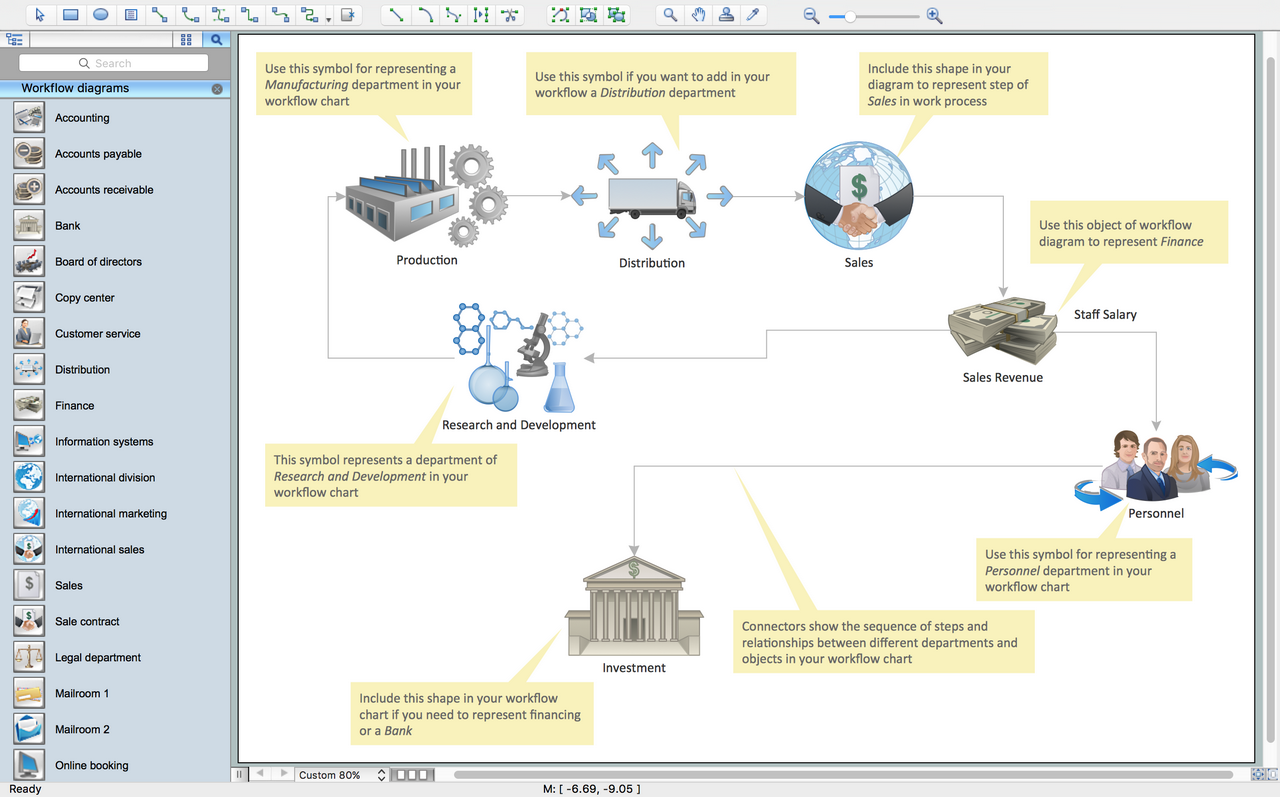
Picture: Create Workflow Diagram
Related Solution:
This will let you create professional diagrams and charts using its simple RapidDraw option just in clicks. Take a look on a diagram you are looking for and create it fast and quickly.
Picture: Powerful Drawing Feature for Creating Professional Diagrams
Why do you need a business process flow diagram? How to use business process diagram software? Explore ✔️ the significance, ✔️ creation process, and ✔️ discover cutting-edge software solutions designed to streamline and optimize your workflows
Picture: Business Process Workflow Diagrams & Software
Related Solution:
Create your own Linux audit flowcharts using the ConceptDraw DIAGRAM diagramming and vector drawing software extended with the Audit Flowcharts solution from the Finance and Accounting area of ConceptDraw Solution Park.
This flowchart example describing auditd, the linux audit tool.
Picture: Linux Audit Flowchart Example. Flowchart Examples
Related Solution:
When you need a drawing software to create a professional looking cross-functional charts, ConceptDraw with its Arrows10 Technology - is more than enough versatility to draw any type of diagram with any degree of complexity.
Use templates with process maps, diagrams, charts to get the drawing in minutes.
Picture: Cross-Functional Process Map Template
This template shows the Context Diagram. It was created in ConceptDraw DIAGRAM diagramming and vector drawing software using the Block Diagrams Solution from the “Diagrams” area of ConceptDraw Solution Park.
The context diagram graphically identifies the system. external factors, and relations between them. It’s a high level view of the system. The context diagrams are widely used in software engineering and systems engineering for designing the systems that process the information.

Picture: Context Diagram Template
Related Solution:
The affinity diagram is a business tool used to organize ideas and data. It is one of the Seven Management and Planning Tools. But how design the Affinity Diagram quick and easy? ConceptDraw DIAGRAM diagramming and vector drawing software offers the Seven Management and Planning Tools Solution from the Management Area.
Picture: Affinity Diagram
Related Solution:
Interactive tool helps you find the appropriate response to social media mentions quickly.
Picture: How to Use the ″Online Store PR Campaign″ Sample
Related Solution:
This action mindmap helps to quick answer customers' frequently asked questions and to provide useful info about bank services.
Picture: Bank Detailed Answers
Related Solution: