Best Flowchart Software and Flowchart Symbols
ConceptDraw DIAGRAM
For years ConceptDraw has been flowchart maker delivering high quality business process flow design solutions, turning ConceptDraw DIAGRAM into most comprehensive and powerful examples of best flowchart software available. Solutions have been tailor made to apply to numerous departments and stakeholders within a company, while ConceptDraw specialize in professionally drawn vector stencil graphics of both standardized flowchart notations and typical flowchart symbols, as well as a large selection of themed icons and design elements.
Here are some of the flowcharting solutions for ConceptDraw DIAGRAM
- HR Flowcharts
- Accounting Flowcharts
- Audit Flowcharts
- Sales Flowcharts
- Cross-Functional Flowcharts
- Business Process Diagram
- IDEF0 Diagrams
- Flowcharts
- Business Process Mapping
- Data Flow Diagrams (DFD)
- Workflow Diagrams
- Event-driven Process Chain Diagrams EPC
By using flowcharts, you can map unique company processes at all levels and across all departments, transmit information to important stakeholders, or use your flowchart as part of a presentation - so it is important to have a piece of software powerful and dynamic enough to cater for all flowcharting needs. Combining these solutions with ConceptDraw DIAGRAM gives users all the tools they need to create effective and professional flowchart designs.
ConceptDraw DIAGRAM is a bundle of the vector stencils, examples, and templates include also RapidDraw technology this is the best flowchart software. Start design own flowchart with ConceptDraw DIAGRAM an accomplish great results in the moment.

Sample 1. Best Flowchart Software: flowchart maker, flowchart symbols, template and example
This template explains the basic flow chart symbols.
Use ConceptDraw DIAGRAM diagramming and vector graphics software provides templates, samples and libraries of stencils for drawing flowcharts, diagrams and illustrations.
No other flowchart software gives you all this:
- Design and document using a wide range of pre-drawn colored flowchart shapes, smart connectors and programming flowchart symbols.
- Great value for the money, only $199 dollars.
- Free technology support.
- Free examples and built-in templates to help you draw flowcharts rapidly.
TEN RELATED HOW TO's:
What is a Concept Map and what software is effective for its design? A concept map or conceptual diagram is a diagram that depicts suggested relationships between concepts. As for effective software - we suggest you to pay attention for the ConceptDraw DIAGRAM diagramming and vector drawing software. Extended with Concept Maps Solution from the Diagrams Area it is a real godsend for you.
Picture: What Is a Concept Map
Related Solution:
ConceptDraw DIAGRAM application is perfect for creating workflow diagrams. This application contains specific features and technologies designed to draw diagrams faster, such as RapidDraw and Arrows10. ConceptDraw DIAGRAM software extended with the Workflow Diagrams solution gives you a flexible tool to draw any kind of workflow.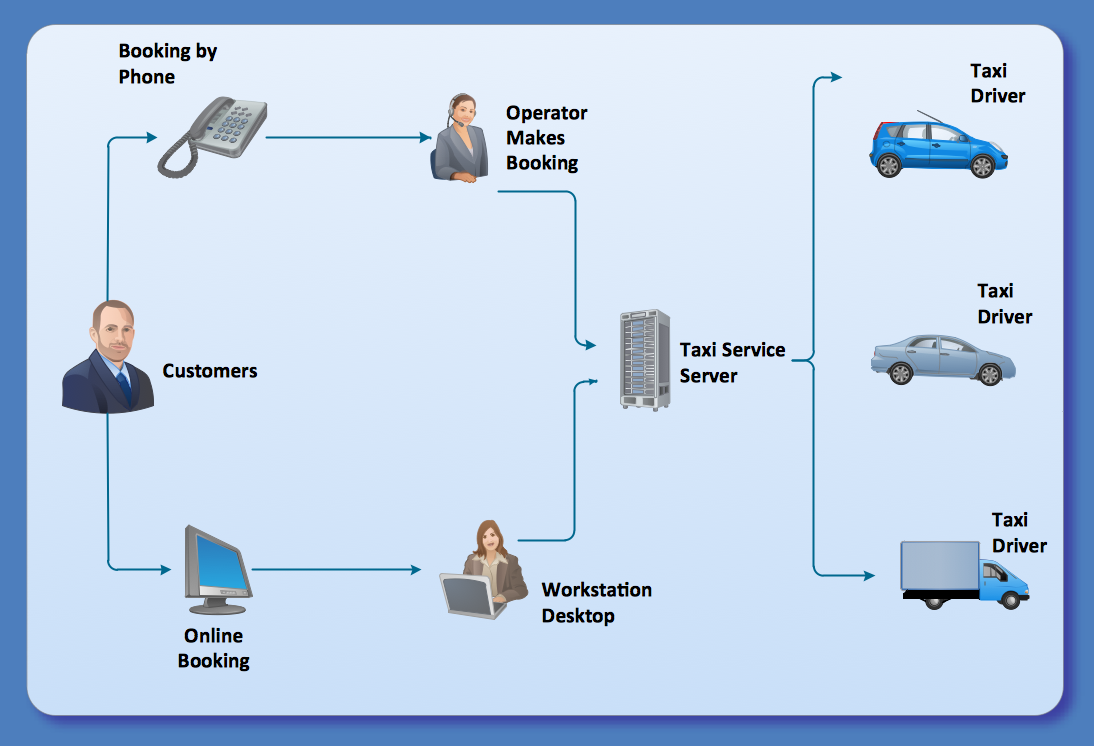
Picture: Workflow Application
Related Solution:
Easy charting software comes with beautiful chart templates and examples. This makes it easy to create professional charts without prior experience.
Picture: Chart Maker for Presentations
Related Solution:
If your company is in chaos in clutter and no one understands their rights and responsibilities, maybe it's time to change that. One of the ways to put the company in order is to draw an organization chart that would reflect the structure and show the relationships among departments and positions. This is a very useful and easy to understand scheme.
This is example of the one of the most typical kind of organizational chart. It depicts an organizational structure of the hierarchical type. Its construction is similarv to pyramid. The single main position on the top - in this case, the mayor's position followed by sub-levels of authority in his command. Each position in the pyramid reports only to his supervisor, and takes only a report of direct subordinates. Such scheme limits the number of communications. This organizational structure is effectively used in public organizations. Also it is suitable for any organization with the need for multiple levels of middle managers. The ability to create organizational charts of different types is supplied with ConceptDraw Ogrcharts solutions.
Picture: How to Draw an Organizational Chart
Related Solution:
ConceptDraw DIAGRAM diagramming and vector drawing software extended with Flowcharts Solution from the 'Diagrams' area of ConceptDraw Solution Park is a powerful tool for drawing Flow Charts of any complexity you need. Irrespective of whether you want to draw a Simple Flow Chart or large complex Flow Diagram, you estimate to do it without efforts thanks to the extensive drawing tools of Flowcharts solution, there are professional flowchart symbols and basic flowchart symbols. This sample shows the Gravitational Search Algorithm (GSA) that is the optimization algorithm.
Picture: Simple Flow Chart
Related Solution:
Beginning from the 19th century, people tried to tame electricity. Nowadays, electrical engineering covers a wide range of applications starting from providing illumination in our homes to developing space technologies. Considering the fact that every project needs documentation, engineers use electrical diagram software to develop these projects. Standard electrical symbols of electrical components are recognizable all around the world.
This illustration represents the 26 libraries that are supplied by the ConceptDraw Electrical Engineering solution. The Electric Engineering libraries contains about a thousand objects enabling you to draw various charts depicting electrical connections and circuits, along with schemes of different equipment and devices. The electric engineering libraries delivered with ConceptDraw solution meet the standards adopted in the image to electrical circuits. So they can be used by professionals along with amateurs in electrical engineering.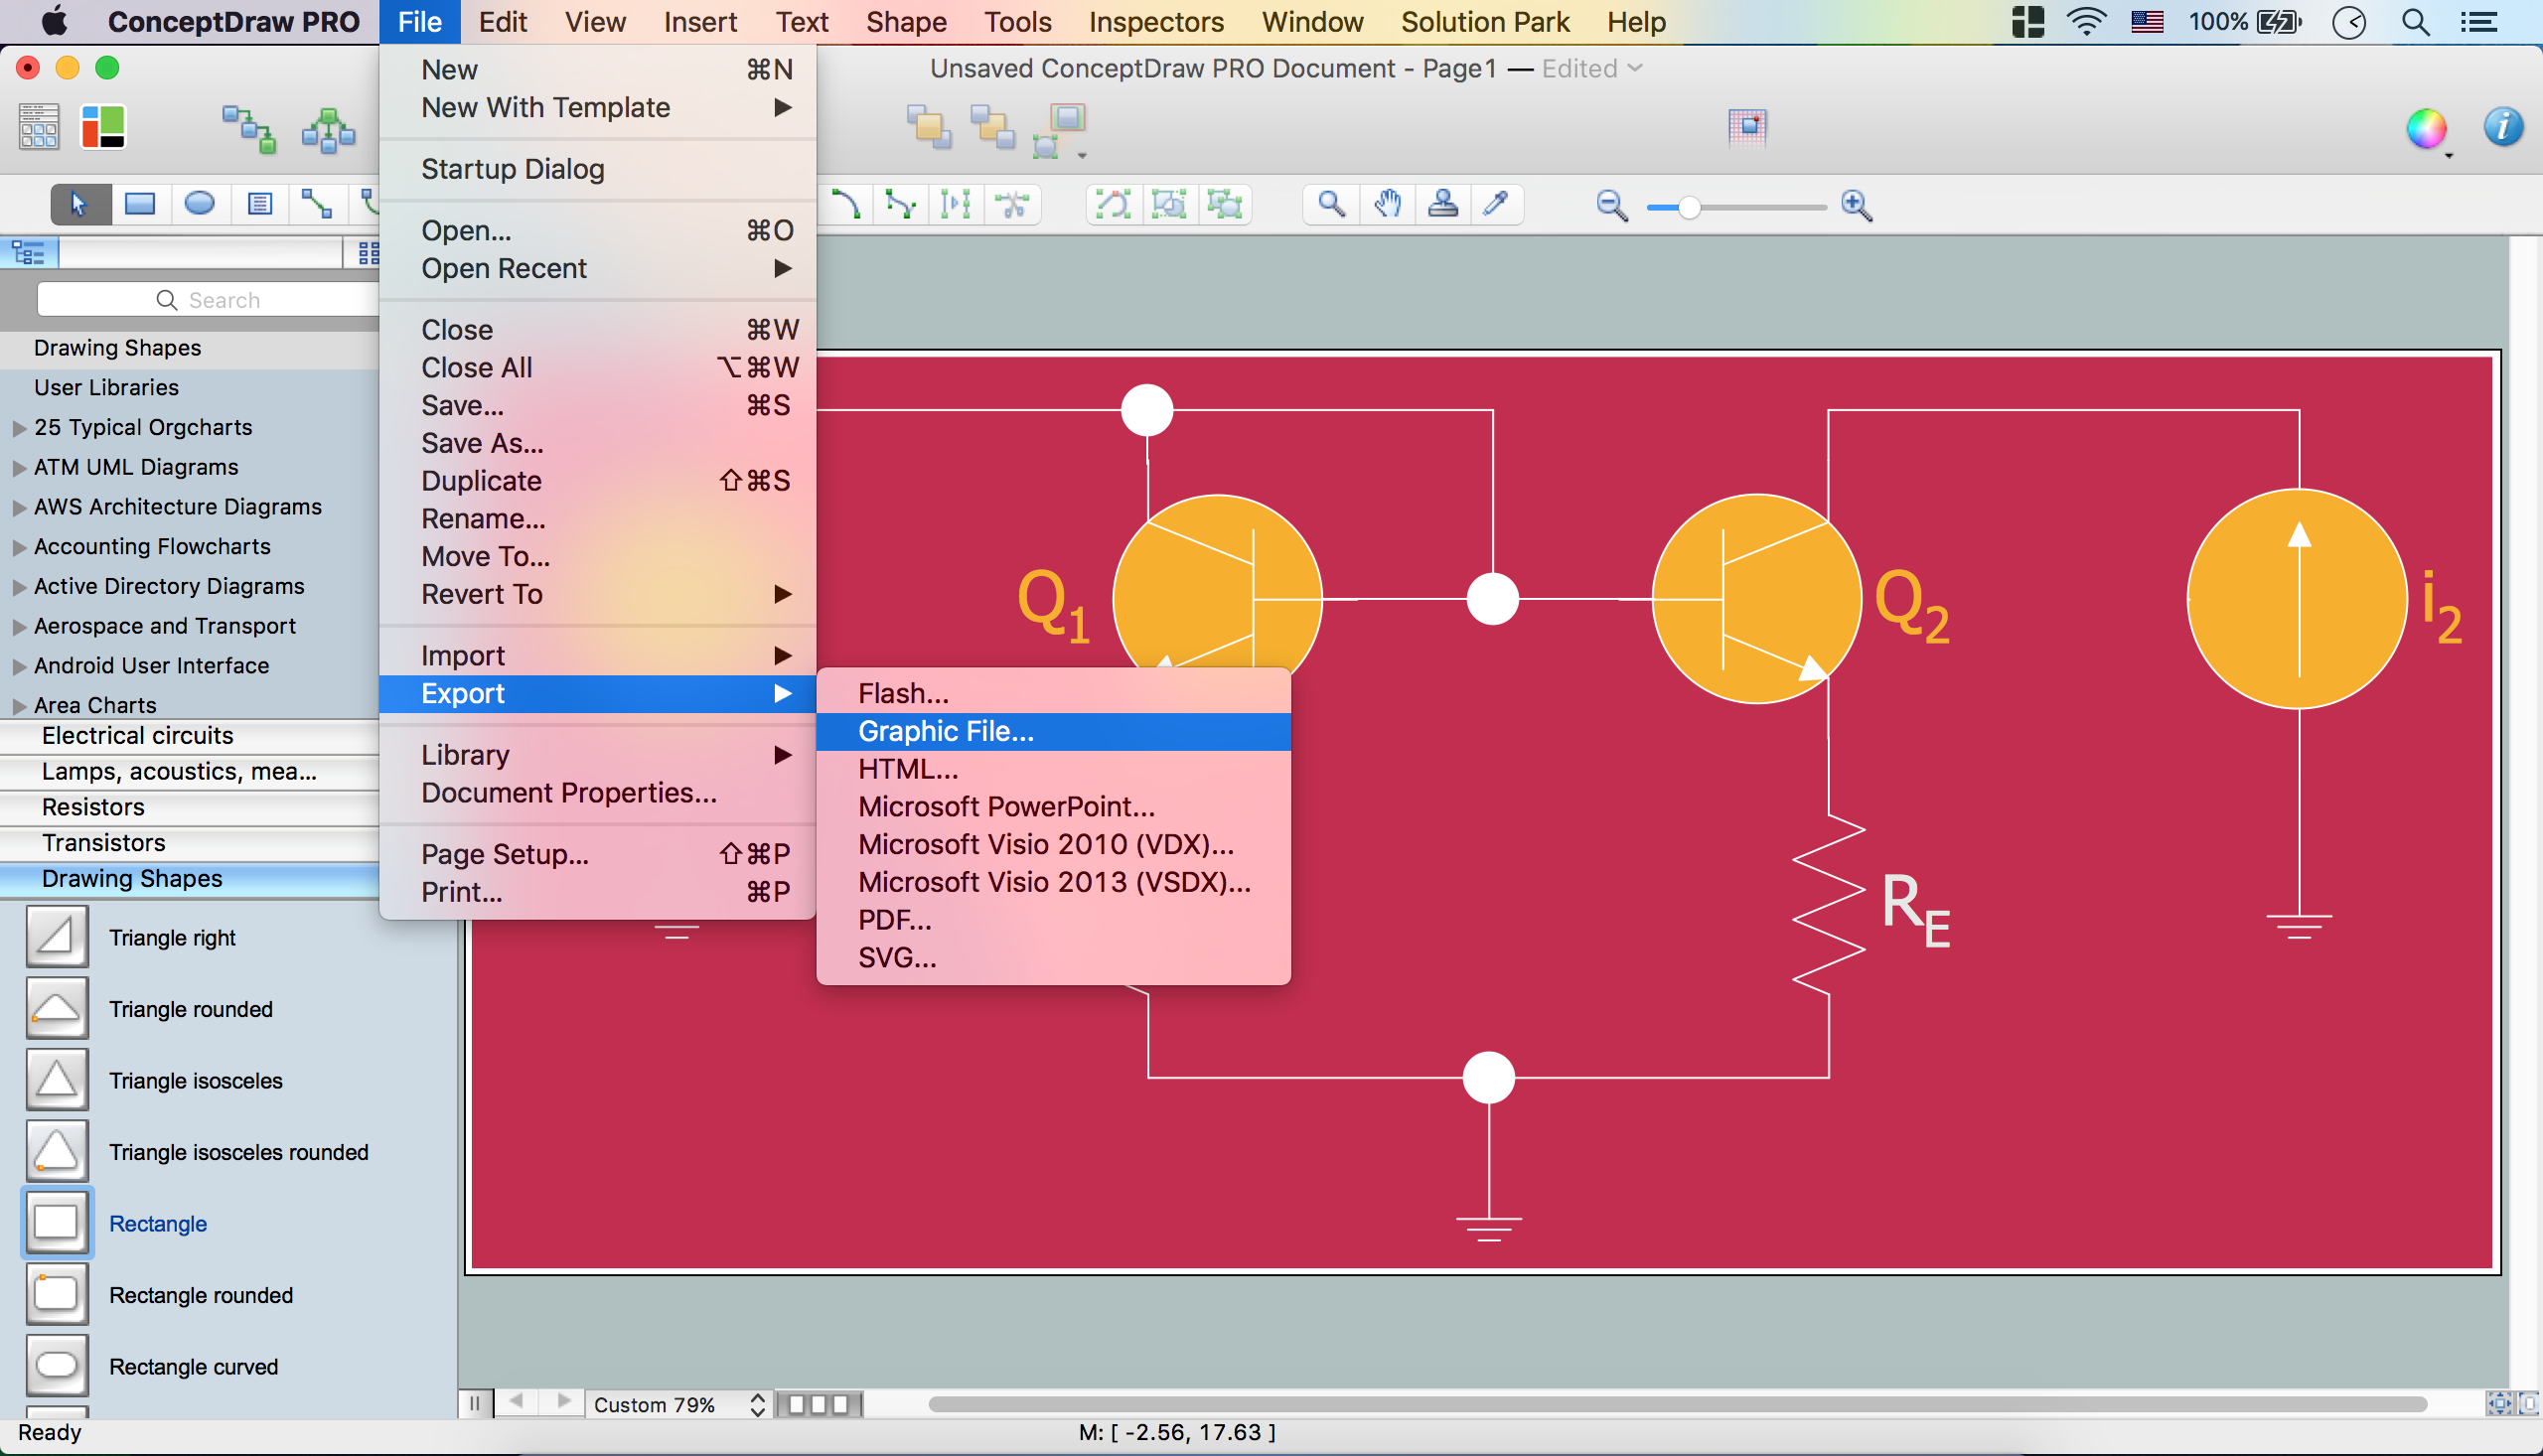
Picture: Electrical Diagram Software
Related Solution:
Use ConceptDraw DIAGRAM diagramming and business graphics software to draw your own flowcharts of computer algorithms.
Picture: Process Flow app for macOS
Related Solution:
Use ConceptDraw DIAGRAM diagramming and business graphics software to draw your own flowcharts of business processes.
Picture: How to Draw an Effective Flowchart
Related Solution:
House of Quality Matrix Software - Use the predesigned objects from the Involvement Matrix Objects Library from the Seven Management and Planning Tools Solution to create professional looking House of Quality Matrices in minutes.
Picture: House of Quality Matrix Software
Related Solution:
Nowadays, it's easy to create any drawing with appropriate software tools. Special Seating Plan solution from Building Plans area has all the design elements possible to create any seating plan that you might need. It might be a plan of a theater, or a cinema or even a wedding plan.
A seating plan is an indispensable element of any public event organization. Well thought-out arrangement of seats, furniture and other items help making the event a successful and effective. If you are organizing a spectacular event in a big theater or in a banquet hall, ConceptDraw Seating Plans solution is the tool for you. Especially its library of graphic elements for large and small blocks of seats, stairs, sectors, stage and backstage - just 67 vector objects. The Seating Plans Solution is specially developed for seating plans easy construction. With the help of this solution you'll quickly sketched the seating plan for any event
Picture: Building Drawing Software for Design Seating Plan
Related Solution: