Mind Map Making Software
ConceptDraw MINDMAP
Capture What You Think, Do What You Plan
ConceptDraw MINDMAP is a powerful business and personal productivity software application that provides professional tools for brainstorming, thinking and project planning, generating and organizing the ideas and data, problem solving and other tasks.
ConceptDraw MINDMAP offers a variety of input and output solutions that allow create, change and share your mind maps quickly, simply and effectively. ConceptDraw MINDMAP allows to output your mind map to MS PowerPoint, MS Project, MS Word, save as PDF, Web-page (HTML), outline (Text Outline, RTF, OPML) or image. You can also input your data from MS PowerPoint, MS Project, MS Word, MindManager, XMind, OPML and Text Outline sources.
ConceptDraw MINDMAP provides the Input templates that will help you to create the mind map in one moment.

Pic.1. MindMap Software - Start
ConceptDraw MINDMAP allows you quickly and effectively generate, change, and update your mind maps.

Pic.2. Mind Map Making Software
It’s very simple and quick to design the mind maps in ConceptDraw MINDMAP You can customize the style of your mind maps, change the form and color of the topics in one click.
There is nothing easier than adding images to create the mind map of your own distinct style. ConceptDraw MINDMAP provides many clip art images and Quick Symbols. You can insert the images into the topics or into the empty space on your mind map.
You can also create the multipage mind maps and mind maps with multiple main ideas in ConceptDraw MINDMAP

Pic.3. MindMap Software - Result
This sample was created with ConceptDraw MINDMAP mind mapping software quick and easy.
See for yourself the suitability of ConceptDraw MINDMAP by downloading our 21-day trial .
The power, economy, and versatility of ConceptDraw MINDMAP takes personnel and team productivity to another level. Discover today what this means to you.
See also Samples of mind maps:
- Mind Maps
- Mind Maps — Marketing
- Mind Maps — Idea Communication
- Mind Maps — Mind Map Exchange
-
Mind Maps — Presentation Exchange
TEN RELATED HOW TO's:ConceptDraw DIAGRAM keeps the entire team on the same page allowing you to realize your social media strategy, improve the quality of your answers, and minimize the time it takes to respond.
 Picture: How To Organize Response ProcessRelated Solution:Unfortunately, a man can’t predict the future and no one is safe from natural disasters, such as floods, earthquakes, hurricanes or fires. Nonetheless, what you can do to ensure safety for you and your relatives is to create an emergency plan, so everyone will know what to do if emergency happens. Keep that plan simple and train it several times a year so that no one could forget any details of it. Fire and emergency plans are important to supply people with a visual safety solution. This diagram presents a set of standard symbols used to depict fire safety, emergency, and associated information. Using clear and standard symbols on fire emergency plans provides the coherence of collective actions , helps to avoid embarrassment, and improves communications in an emergent situation. The fire emergency symbols are intended for the general emergency and fire service, as well as for building plans ,engineering drawings and insurance diagrams. They can be used during fire extinguishing and evacuation operations, as well as trainings. It includes vector symbols for emergency management mapping, emergency evacuation diagrams and plans.
 Picture: Emergency PlanRelated Solution:This sample was created in ConceptDraw DIAGRAM diagramming and vector drawing software using the Organizational Charts Solution from the Management area of ConceptDraw Solution Park. The Organizational Chart is a diagram that shows the structure of the organization, different levels of management, hierarchy and the relationships of the organization parts.
 Picture: Horizontal Org Flow ChartRelated Solutions:Electrical Engineering Solution used together with ConceptDraw DIAGRAM drawing facilities makes short a work of drawing various electrical and electronic circuit schemes. A library of vector objects composed from symbols of Analog and Digital Logic elements of electric circuit includes 40 symbolic images of logic gates, bistable switches of bi-stable electric current, circuit controllers, amplifiers, regulators, generators, etc. All of them can be applied in electronic circuit schemes for showing both analog and digital elements of the circuit. Electrical Engineering Solution used together with ConceptDraw DIAGRAM drawing facilities makes short a work of drawing various electrical and electronic circuit schemes. A library of vector objects composed from symbols of Analog and Digital Logic elements of electric circuit includes 40 symbolic images of logic gates, bistable switches of bi-stable electric current, circuit controllers, amplifiers, regulators, generators, etc. All of them can be applied in electronic circuit schemes for showing both analog and digital elements of the circuit.
 Picture:Electrical Diagram Symbols F.A.Q.How to Use Electrical ConceptDraw Diagram SoftwareRelated Solution:How to make a Concept Map fast and easy? ConceptDraw DIAGRAM diagramming and vector drawing software extended with Concept Maps Solution from the Diagrams Area is the best choice for those who want design professional looking Concept Map in minutes.
 Picture: How To Make a Concept MapRelated Solution:Geo Map Software - Full Geographic Reach of Your Business with Geo Map Shapes.
 Picture: Geo Map SoftwareRelated Solution:You need design Electrical Schematic and dream to find the useful tools to draw it quick and easy? ConceptDraw DIAGRAM offers the unique Electrical Engineering Solution from the Industrial Engineering Area which will effectively help you!
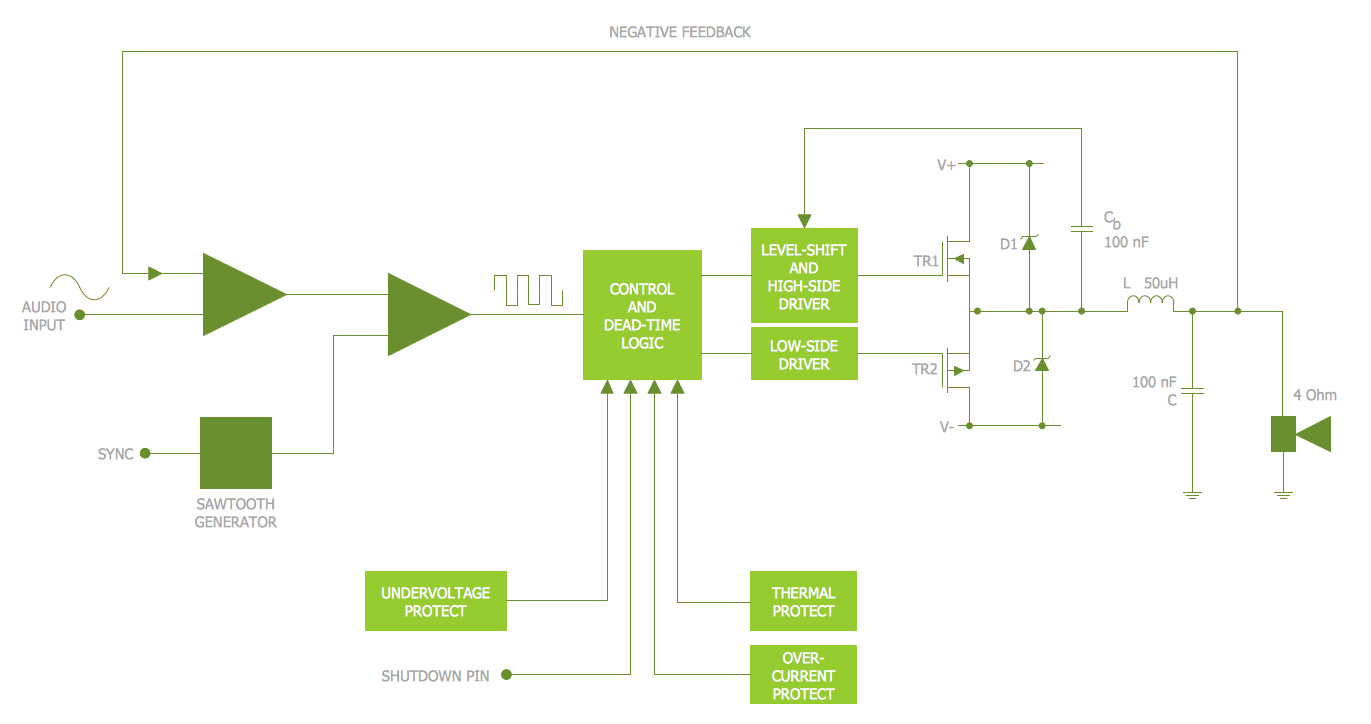 Picture: Electrical SchematicRelated Solution:ConceptDraw MINDMAP is effective Mind Mapping Software with rich clipart galleries, extensive drawing capabilities, a large quantity of examples of professionally designed mind maps on the different themes and powerful import and export capabilities.
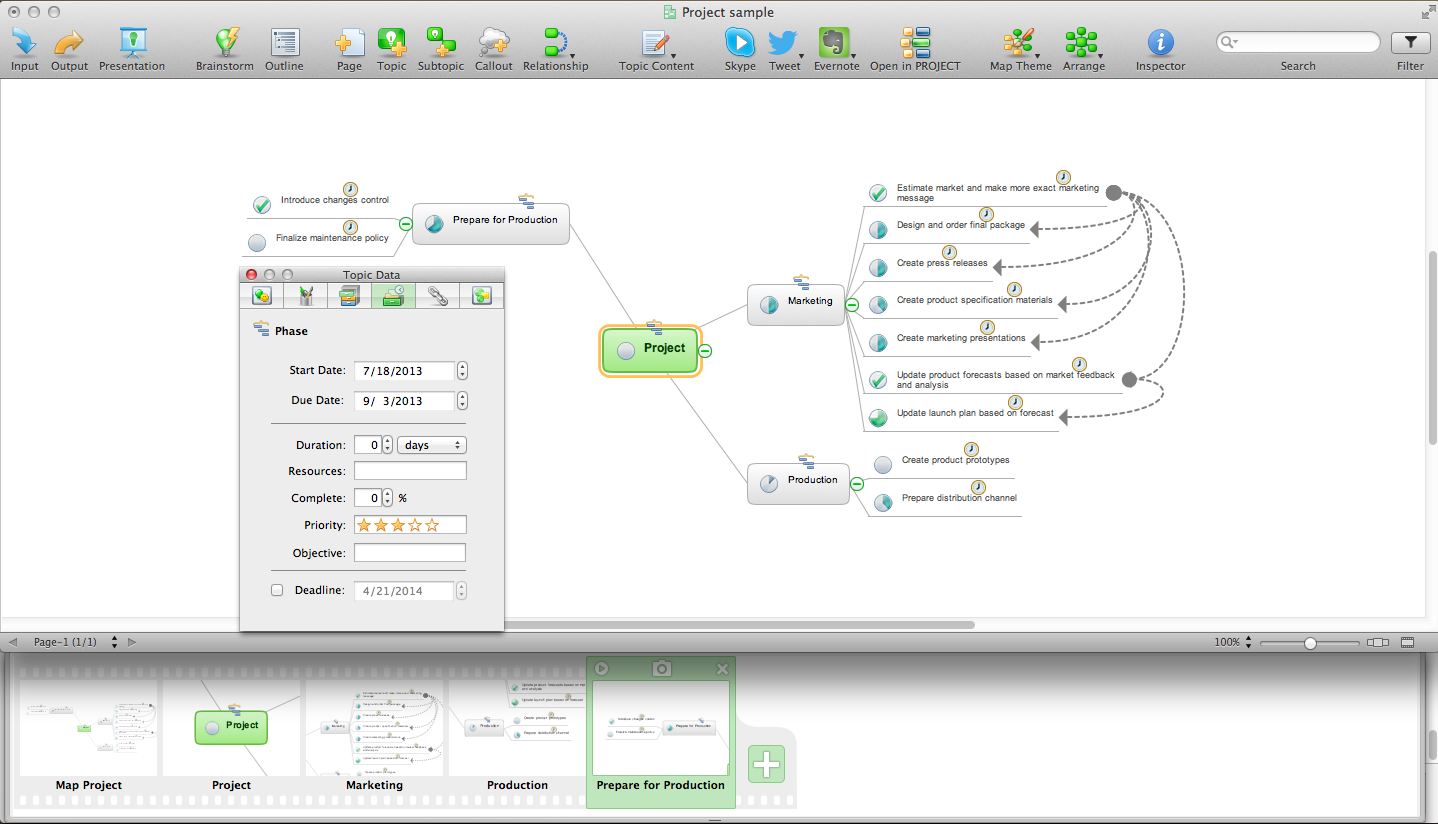 Picture: Mind Mapping SoftwareRelated Solution:Interactive Training via presentations is used widely in education. This is a frequently used tool on training, especially for remote training via Skype.
 Picture: Interactive Training ToolRelated Solution:Use ConceptDraw DIAGRAM diagramming and business graphics software for drawing your own PM life cycle flow charts.
 Picture: Program to Make Flow ChartRelated Solution:ConceptDrawMINDMAP 16