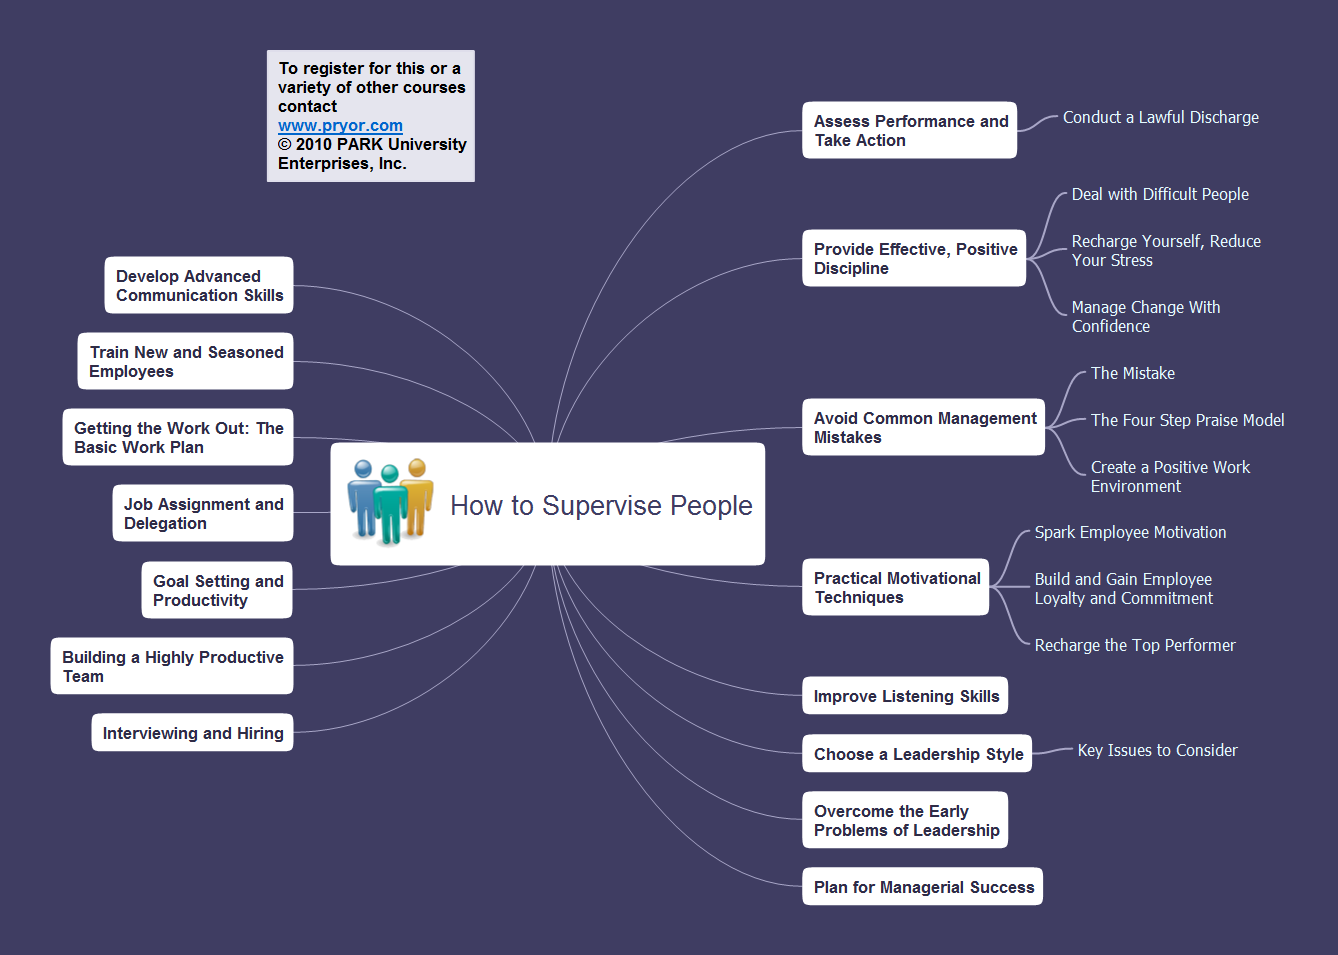
Sample 1. Mindmap presentation - Pryor - How to supervise people.
Presentation Exchange solution extends ConceptDraw MINDMAP software with the ability to import presentations from Microsoft PowerPoint, as well as enhancing its existing presentation capabilities.
With the Presentation Exchange solution you can easily extract the content from a PowerPoint presentation to see how it all fits together in a single view. You can review slide content, see how the slides support one another, and refine the story.
TEN RELATED HOW TO's:
ConceptDraw DIAGRAM diagramming and vector drawing software extended with Rapid UML Solution from the Software Development Area is a powerful online diagram tool that will help you design any types of UML diagrams simply and fast.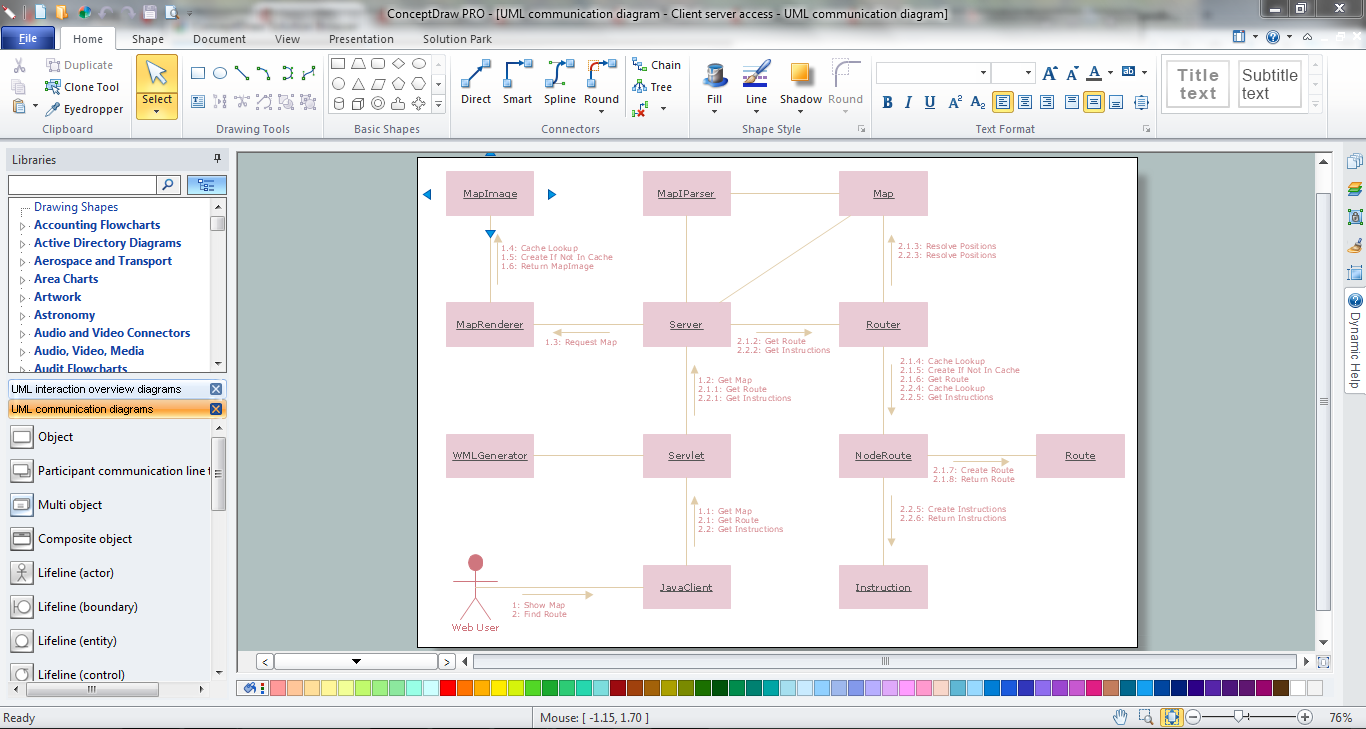
Picture: Online Diagram Tool
Related Solution:
Tools to do presentation of mindmaps via Skype.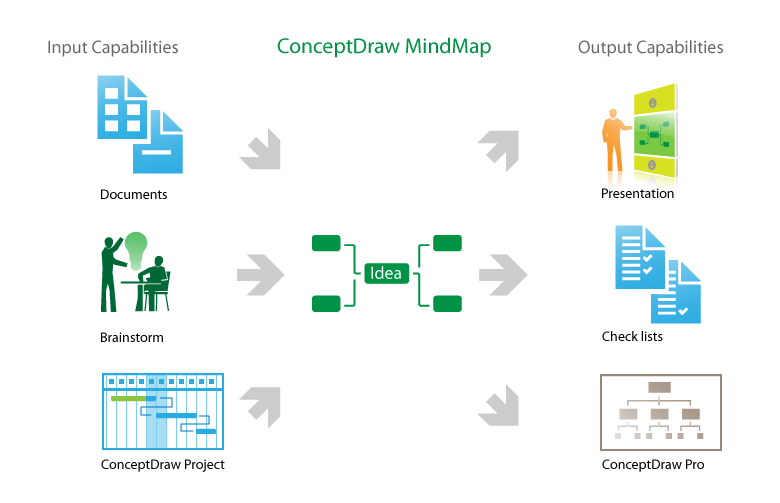
Picture: How to do presentation of Mind Maps via Skype conference call?
Related Solution:
The Pie Chart visualizes the data as the proportional parts of a whole and looks like a disk divided into sectors. The pie chart is type of graph, pie chart looks as circle devided into sectors. Pie Charts are widely used in the business, statistics, analytics, mass media. It’s very effective way of displaying relative sizes of parts, the proportion of the whole thing.
Picture: Pie Chart Word Template. Pie Chart Examples
Related Solution:
The Note Exchange solution lets you to publish content from ConceptDraw MINDMAP to your Evernote account. It can help you to organize and manage your Notebooks quickly and easily.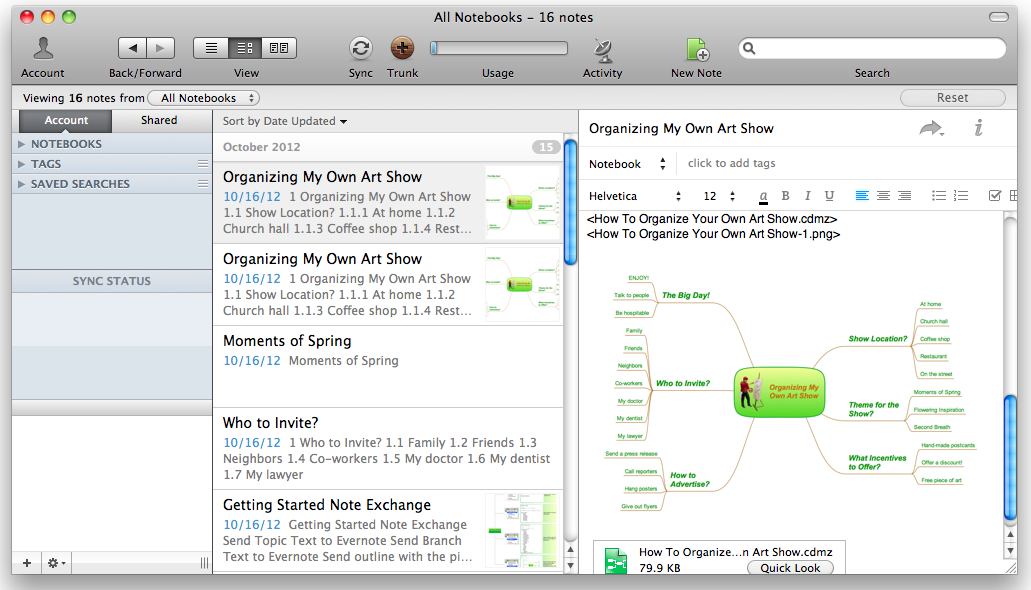
Picture: Export from ConceptDraw MINDMAP to Evernote
Related Solution:
ConceptDraw MINDMAP has impressive import and export capabilities includes following formats:
OPML
Mindjet™ MindManager™
Microsoft™ Office products:
PowerPoint™
Project™
Word™
FreeMind (import only)
XMind (import only)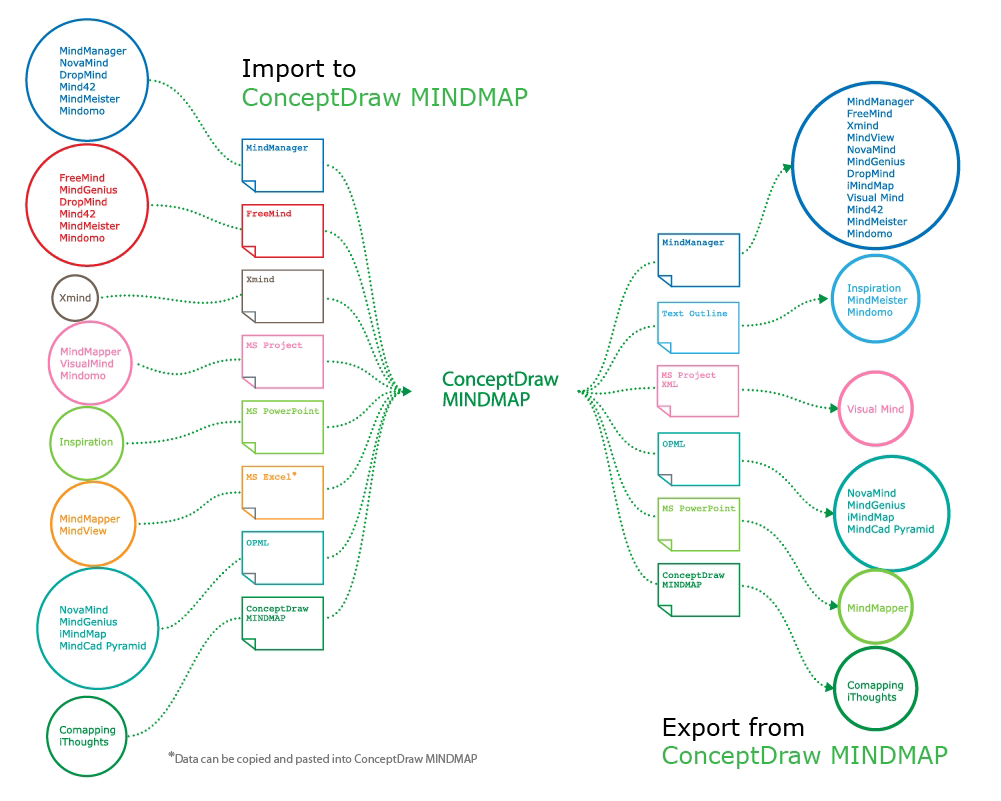
Picture: How to Exchange ConceptDraw MINDMAP Files with Mindjet MindManager
Related Solution:
Compare flowchart software by type, features, and workflow fit. Learn the difference between desktop and online tools and choose the right solution for documentation or collaboration.
Picture: Flowchart Software: Tools for Process and Workflow Diagramming
Related Solution:
Users can create Value Stream Mapping Presentations using presentation mode in ConceptDraw DIAGRAM.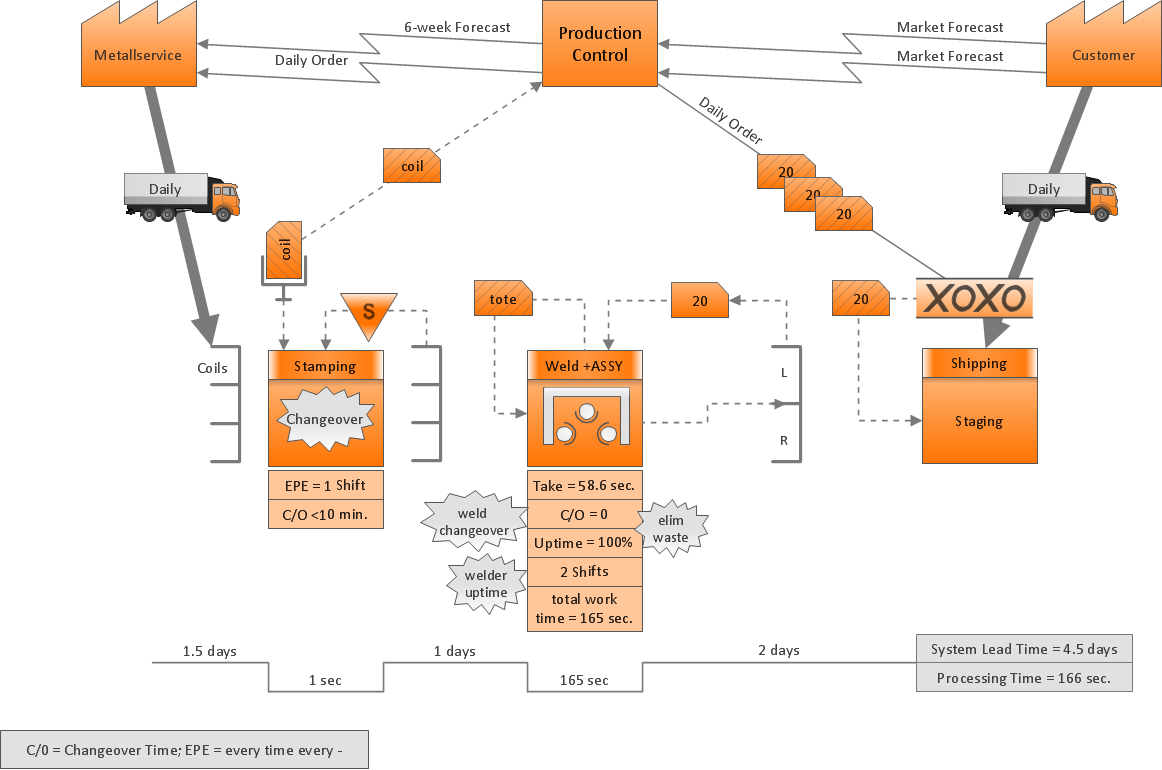
Picture: Value Stream Mapping Presentations
Related Solution:
In ConceptDraw DIAGRAM you can produce ice hockey diagrams of any complexity for any presentaion needs, using a combination of tools. To adopt the sample below for presentation needs place positions and arrows onto different layers of your document and then make them visible one by one during a presentation.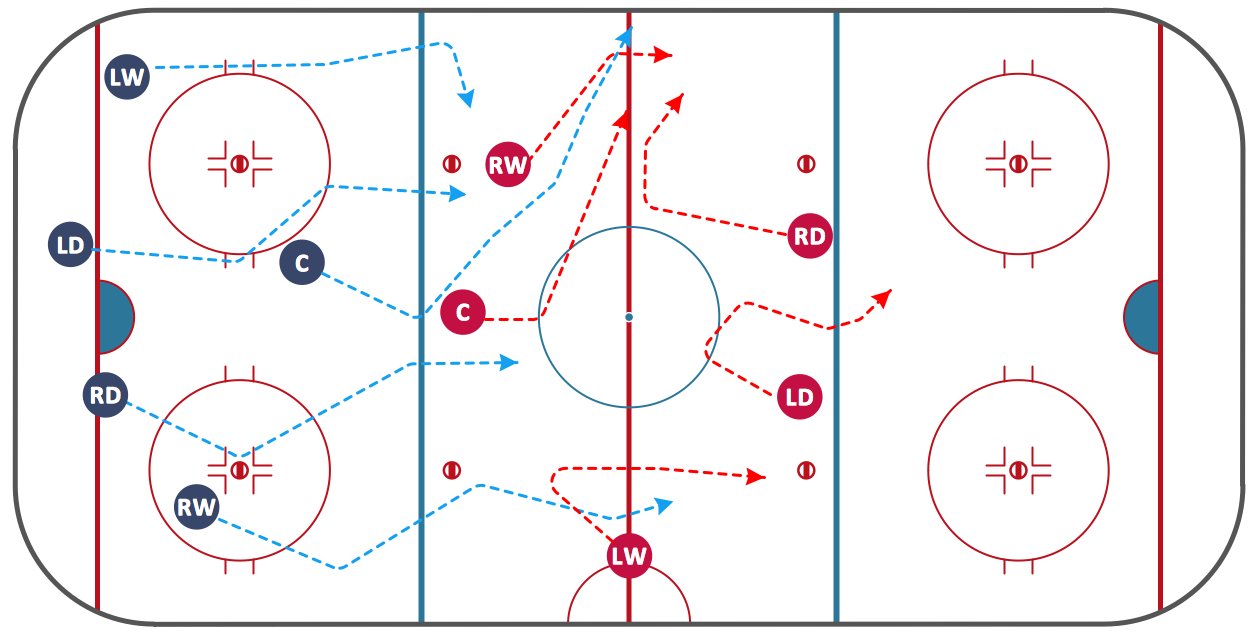
Picture: Ice Hockey Diagram — Defensive Strategy — Neutral Zone Trap
Related Solution:
In case you need to make a plan for your own future hotel or to do it for someone else, then you can always find the way to make such template very quickly and to have a very good looking result in the end. Whichever type of the hotels you want to illustrate in a way of a floor plan, you can always do it with ConceptDraw DIAGRAM drawing application.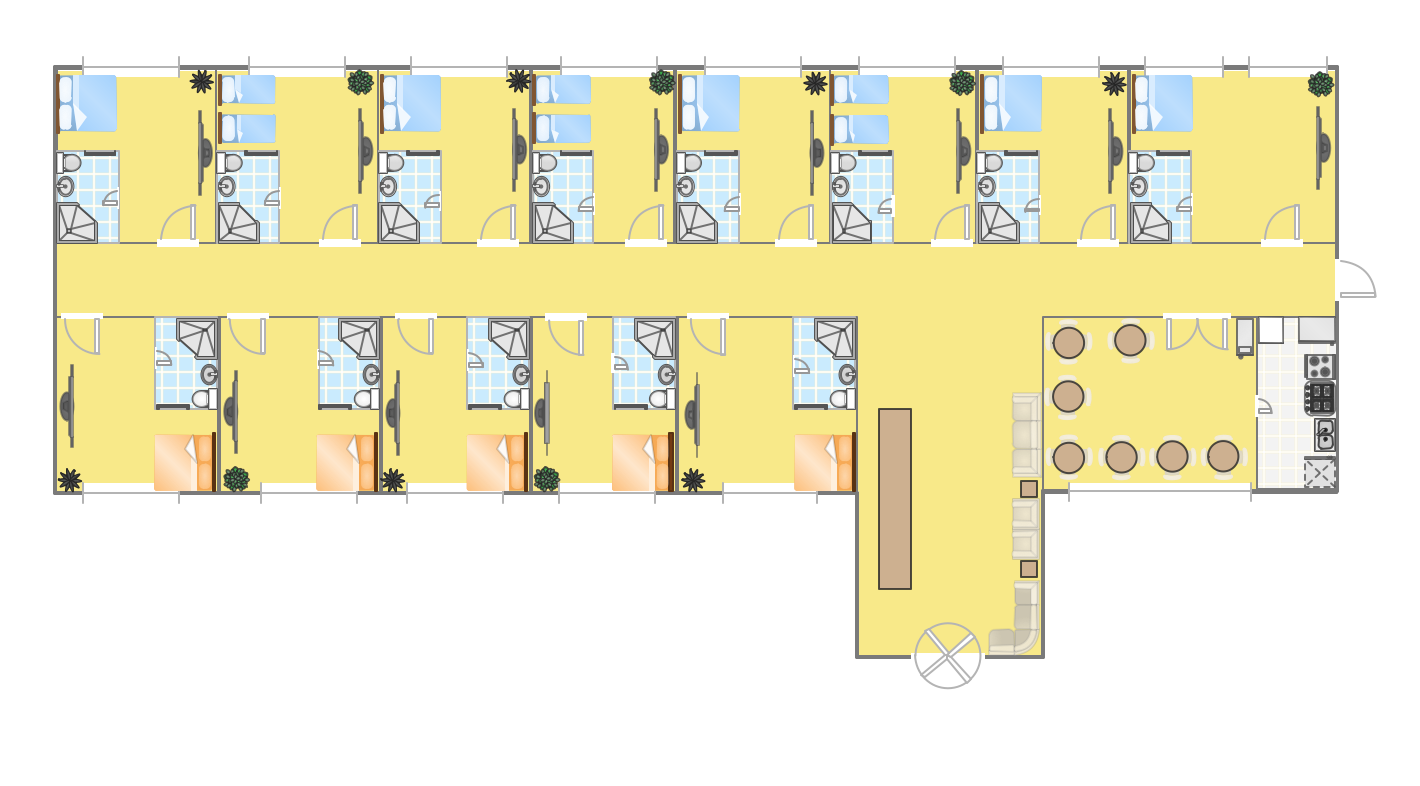
Picture: Hotel Plan. Hotel Plan Examples
Related Solution:
Chemical and Process Engineering solution contains variety predesigned process flow diagram elements relating to instrumentation, containers, piping and distribution necessary for chemical engineering, and can be used to map out chemical processes or easy creating various Chemical and Process Flow Diagrams in ConceptDraw DIAGRAM.
Picture: Process Flow Diagram Symbols
Related Solution: