Process Flow app for macOS
ConceptDraw DIAGRAM macOS software
The ConceptDraw DIAGRAM is a process flow app for Mac. Numerous vector stencils, samples and templates created by designers included I the basic bundle allows you to draw any type of flowchart. Flowcharts give to users the ability to represent structural data visually.

Sample 1. Process Flow app for macOS
Use ConceptDraw DIAGRAM diagramming and business graphics software to draw your own flowcharts.
See also Samples:
TEN RELATED HOW TO's:
A software tool that saves your time on making decisions now has the ability to make decisions with remote team via Skype.
Picture: Decision Making Software For Small Business
Related Solution:
The calendars around us everywhere in the modern world. There are a lot of calendar types, each of them has its own assignment: Business calendar, Personal calendar, Economic calendar, Financial calendar, Daily calendar, Monthly calendar, and many other useful calendar types. ConceptDraw DIAGRAM offers you the possibility to make your own unique calendars on the base of the Blank Calendar Template which is included to the Calendars Solution from the Management Area.
Picture: Blank Calendar Template
Related Solution:
It's impossible to imagine our life without infographics! They are very popular in many fields of science, work and life activity. Management infographics, daily infographic are the good way for representing various information, complex knowledge in a visual comprehensive form. Try design them quick, easy and effective with new powerful Management Infographics Solution from the Business Infographics Area for ConceptDraw Solution Park.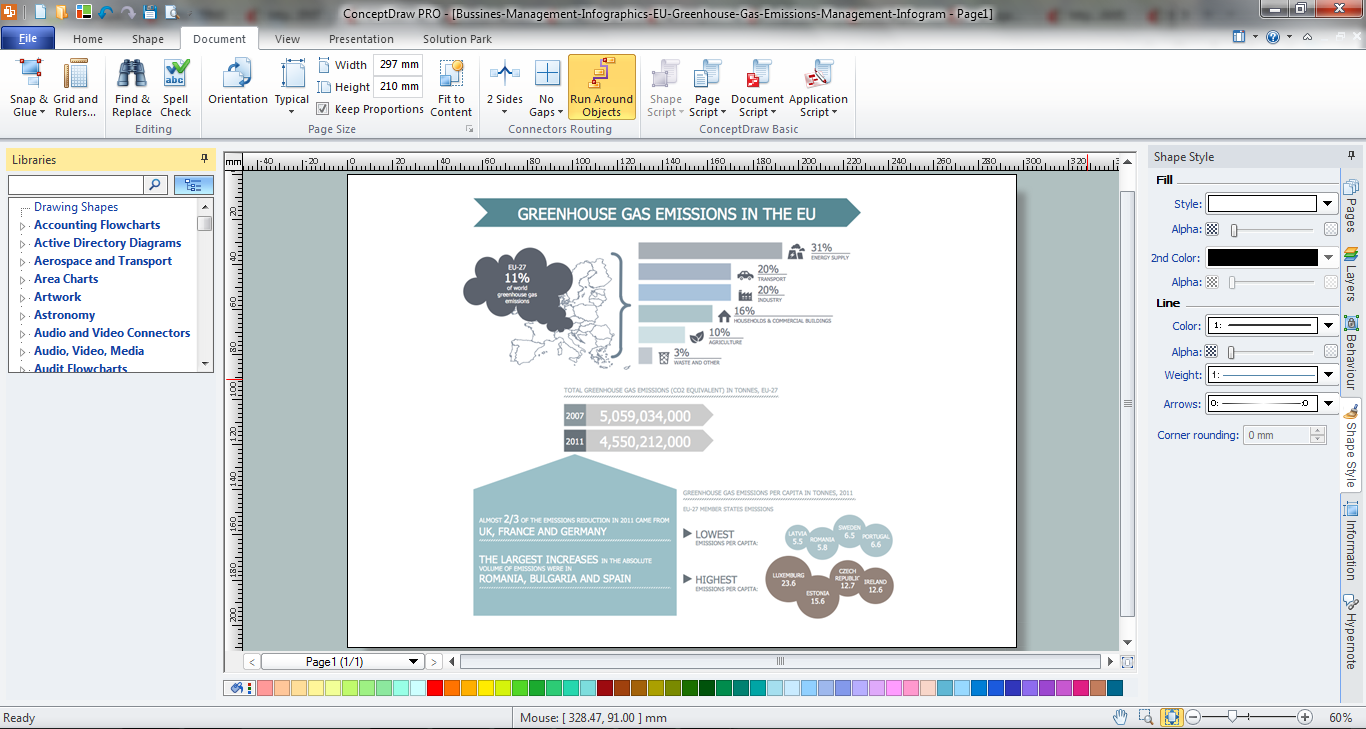
Picture: Daily Infographic
Related Solution:
Plumbing systems are very important for any manufacture, and it's a good practice to have a clear scheme of that system. To create one, you should use a piping and instrumentation diagram software with a possibility to save files in vector format, so you can print them without quality loss. ConceptDraw DIAGRAM is a great tool for creating diagrams, and you don't need to be very experienced to use it efficiently.
This example of Piping and Instrumentation Diagram (P&ID) depicts a scheme that illustrates the physical sequence and functional communications of piping, instrumentation and plumbing equipment components of a typical food trailer.
Seeking to avoid health troubles in a mobile food service , the plumbing demands for food trailers must be considered accurately. This P&ID shows all of piping including a basic set of piping system components along with multiple sinks, extra water heaters and other elements to meet health guidelines.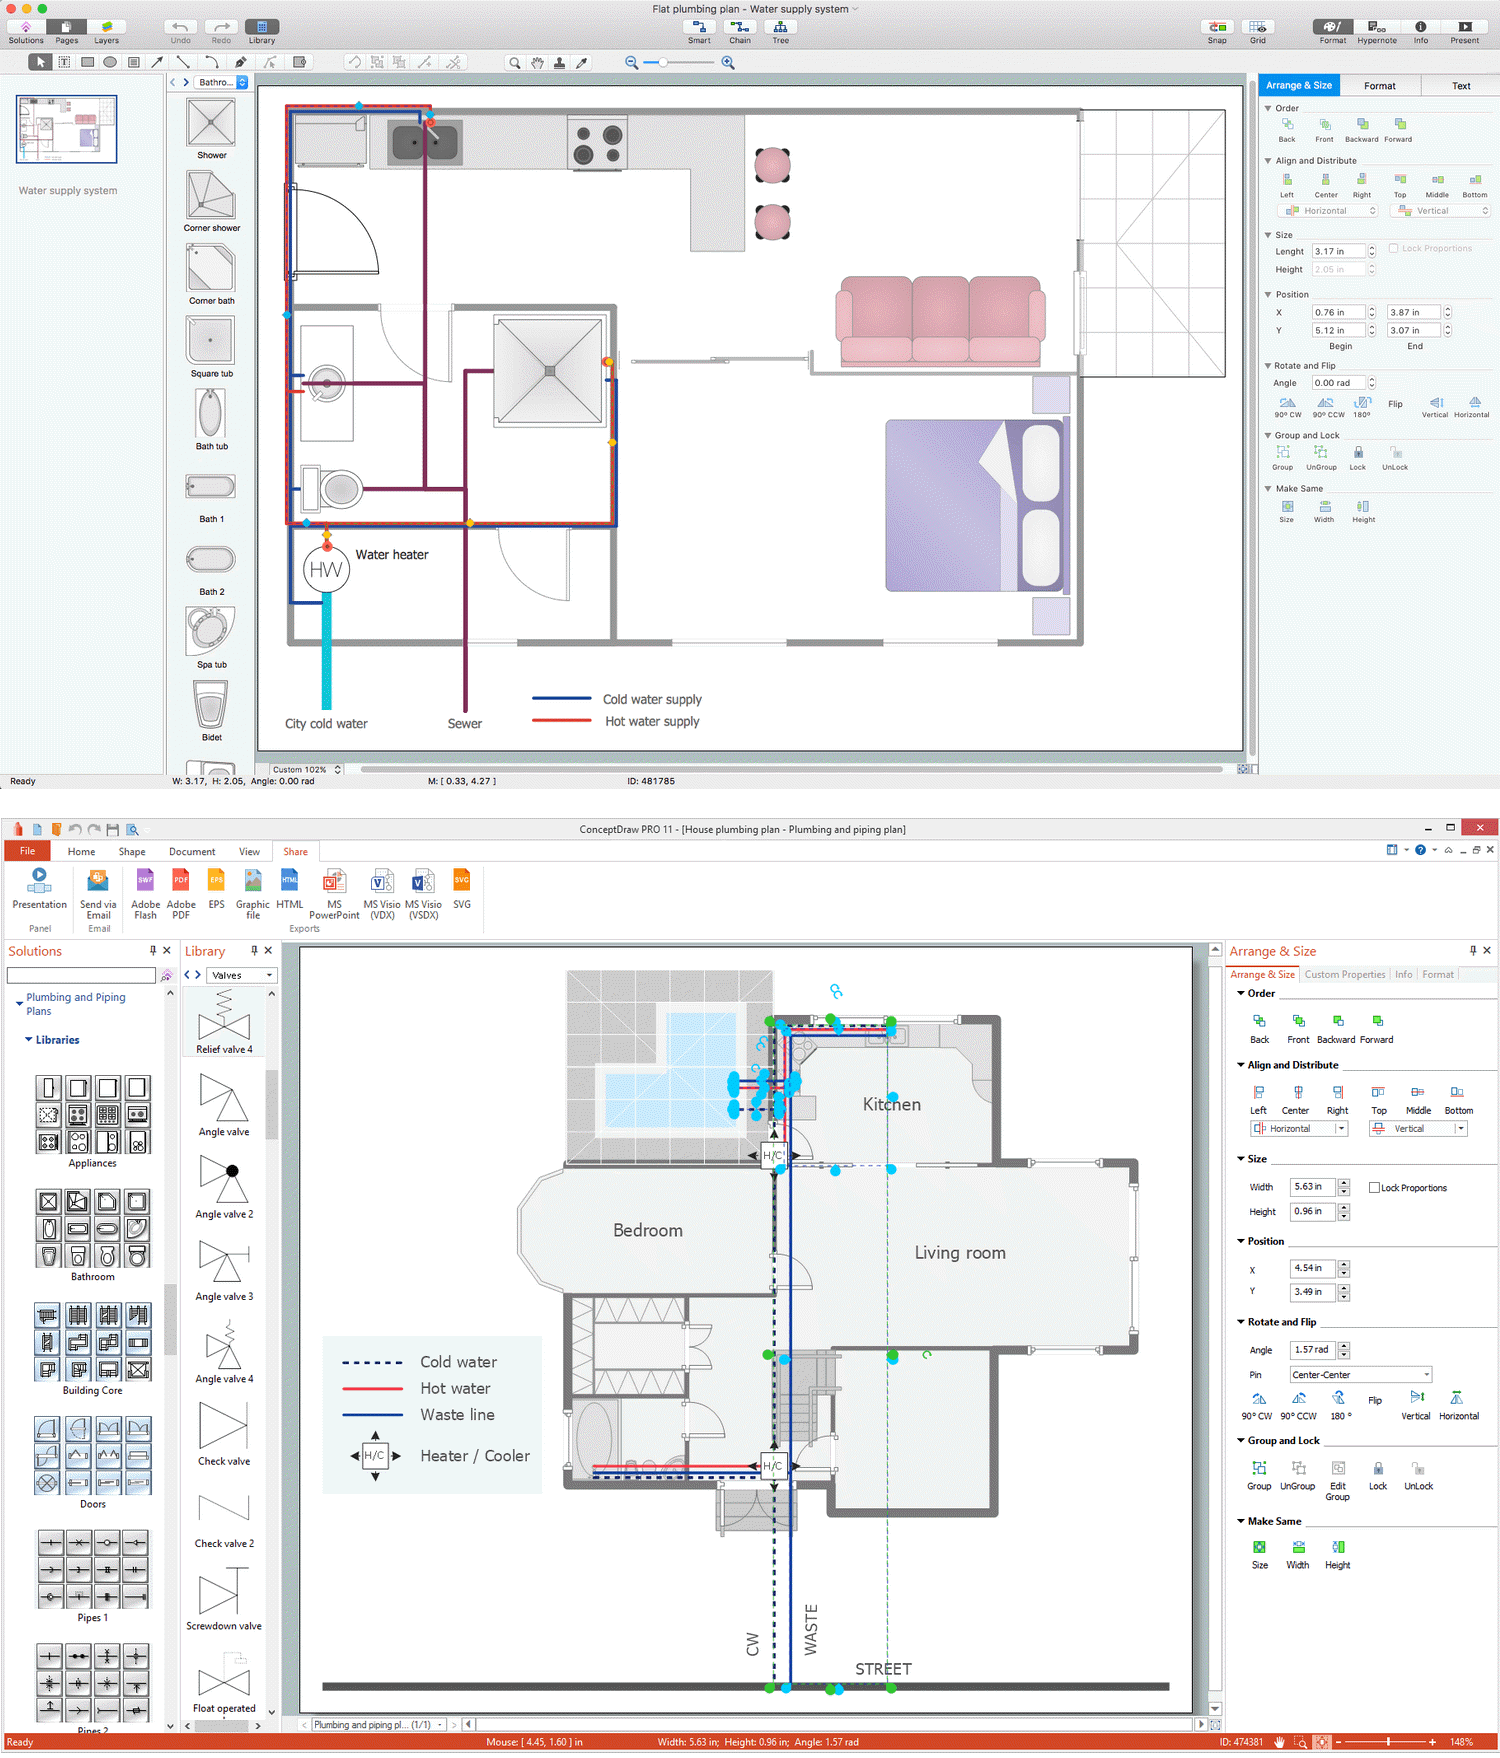
Picture: Piping and Instrumentation Diagram Software
Related Solution:
ConceptDraw is your tool for driving social integration and managing change across and streamline social media processes of your organisation.This tool keeps the entire team on the same page allowing you to realize your social media strategy, improve the quality of your answers, and minimize the time it takes to respond.
Picture: Social Media Response Management DFD Charts - software tools
Related Solution:
This sample was created in ConceptDraw DIAGRAM diagramming and vector drawing software using the Business Process Diagram Solution from the Business Processes area of ConceptDraw Solution Park. The Business Process Solution is based on the standard BPMN 2.0 and includes the set of libraries of ready-to-use objects.
Picture: BPR Diagram. Business Process Reengineering Example
Related Solution:
Automatically create a presentation-quality diagram in one click with ConceptDraw DIAGRAM.
Picture: Visual Presentations Made Easy with Diagramming Software
Related Solution:
Cisco Network Diagrams solution from the Computer and Networks area of ConceptDraw Solution Park provides 14 libraries with 450 ready-to-use predesigned vector objects that can be used for quickly and easily drawing the professional Cisco Network Diagrams.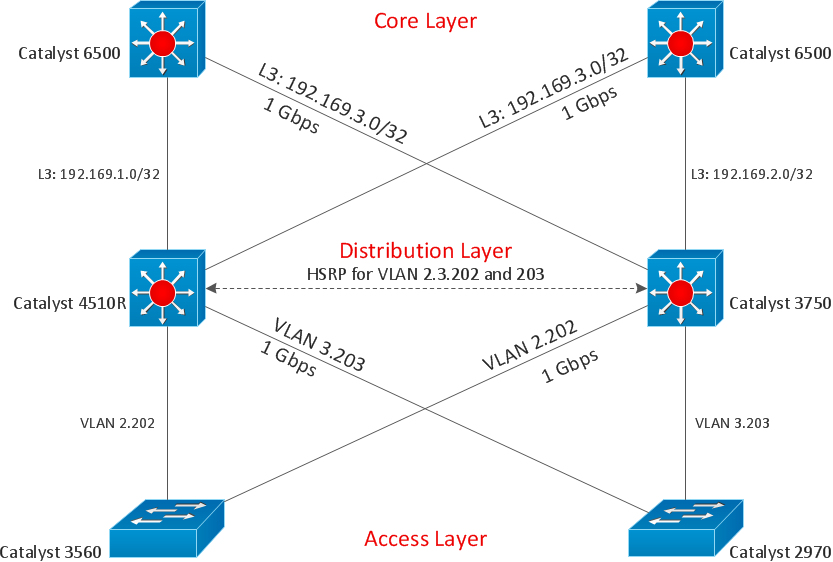
Picture: Cisco Design
Related Solution:
The Line Graphs solution from Graphs and Charts area of ConceptDraw Solution Park contains a set of examples, templates and design elements library of scatter charts.
Use it to draw scatter graphs using ConceptDraw DIAGRAM diagramming and vector drawing software for illustrating your documents, presentations and websites.
Picture: Scatter Chart Examples
Related Solution:
Create Spatial infographics with ConceptDraw using its excellent examples of infographic maps. We hope these can inspire and teach you!
Picture: Excellent Examples of Infographic Maps
ConceptDraw
DIAGRAM 18