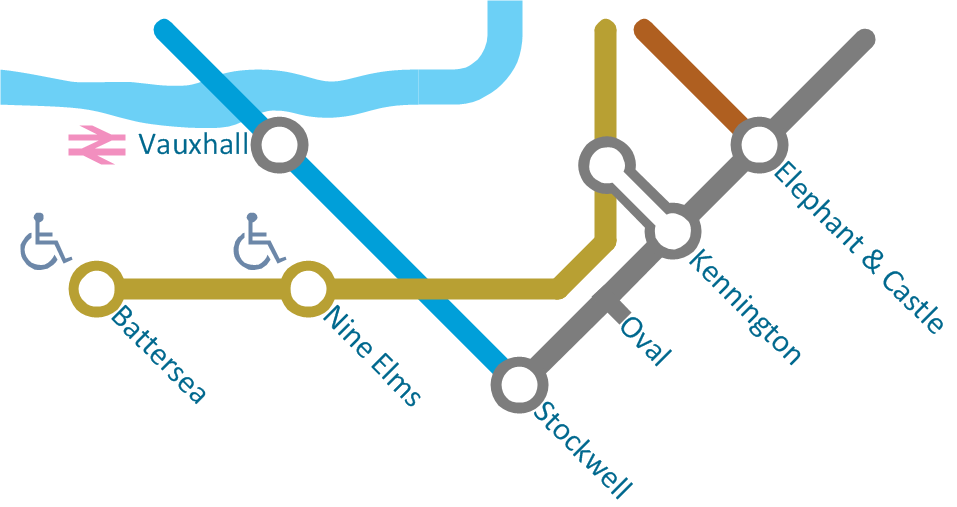
Sample 1. Metro map - Northern line extension to Battersea via Nine Elms.
Solution Spatial Infographics from ConceptDraw Solution Park extends ConceptDraw DIAGRAM ector diagramming and business graphics software with easy-to-use spatial infographics drawing tools.
This solution contains spatial infographics samples, map templates to be filled in, and libraries of vector stencils for main design elements of spatial infographics.
Use this solution to draw your own geospatial infographics documents with thematic maps, road maps, directional maps and transport maps.
NINE RELATED HOW TO's:
Bubble diagrams solution extends ConceptDraw DIAGRAM software with templates, Using ConceptDraw Connectors, you can make a bubble chart in moments. Using ConceptDraw you will be able to make a bubble chart from the ready ConceptDraw library objects or make your own objects. The created diagram can represent ideas organization, in brainstorming processes, by teachers for explaining difficult ideas or for presentations.
Picture: How To Make a Bubble Chart
Related Solution:
You need visually represent the Maps Driving Directions? Now it's incredibly easy to do this in ConceptDraw DIAGRAM diagramming and vector drawing software which was supplied with unique Directional Maps Solution from the Maps Area.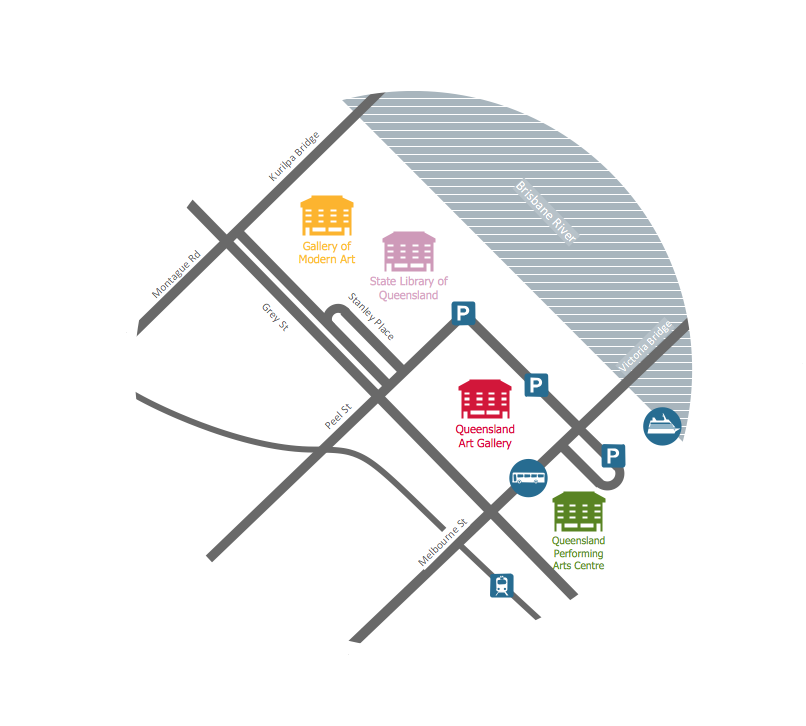
Picture: Maps Driving Directions
Related Solution:
ConceptDraw DIAGRAM software extended with Directional Maps Solution from the Maps Area of ConceptDraw Solution Park offers you the set of useful tools for easy drawing map directions, directional maps, road maps, navigation schemes, transit maps of any complexity, etc.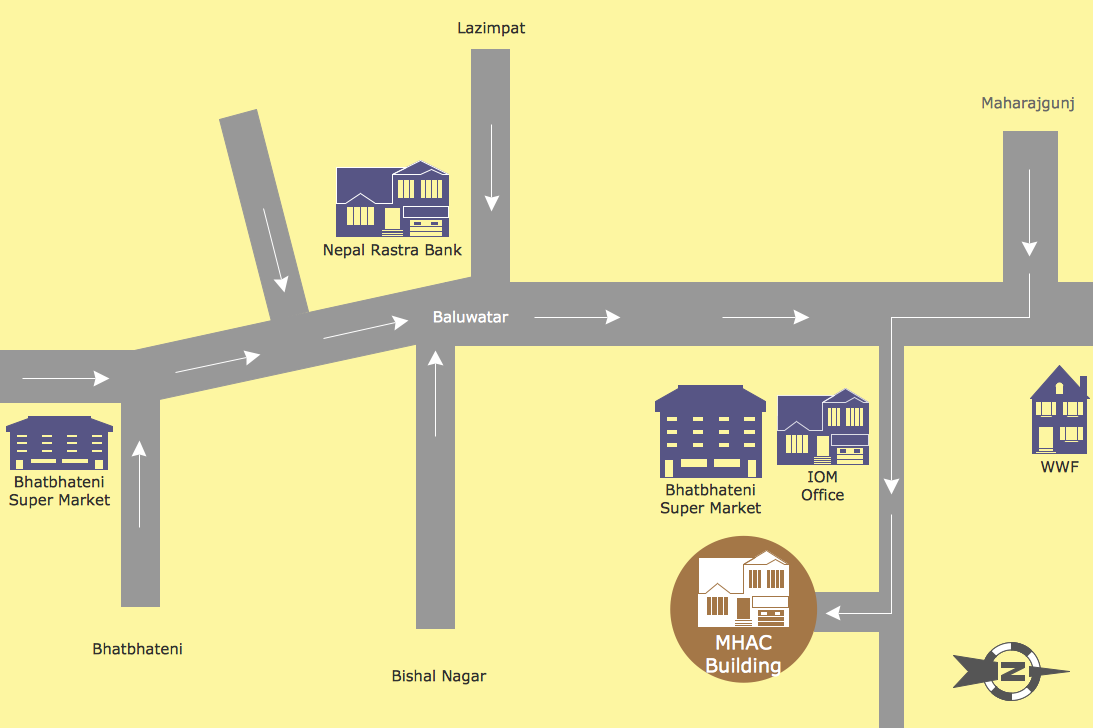
Picture: Map Directions
Related Solution:
Professional Mind Mapping. ConceptDraw MINDMAP professional software to create documents. Mac and PC compatible. MS Office Exchange Solutions. Skype Collaboration. Presentation Tools.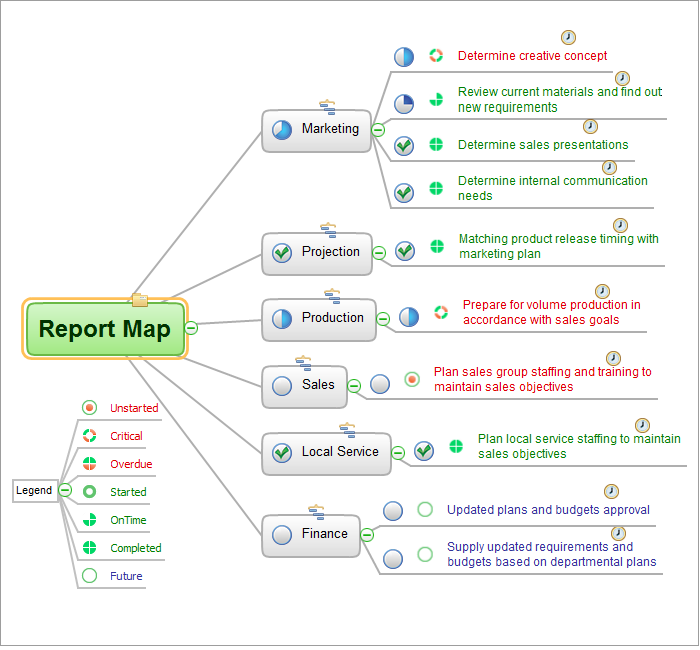
Picture: One formula of professional mind mapping :input data + output data + make great presentation
Related Solution:
Creating Travel infographics is super-easy with ConceptDraw.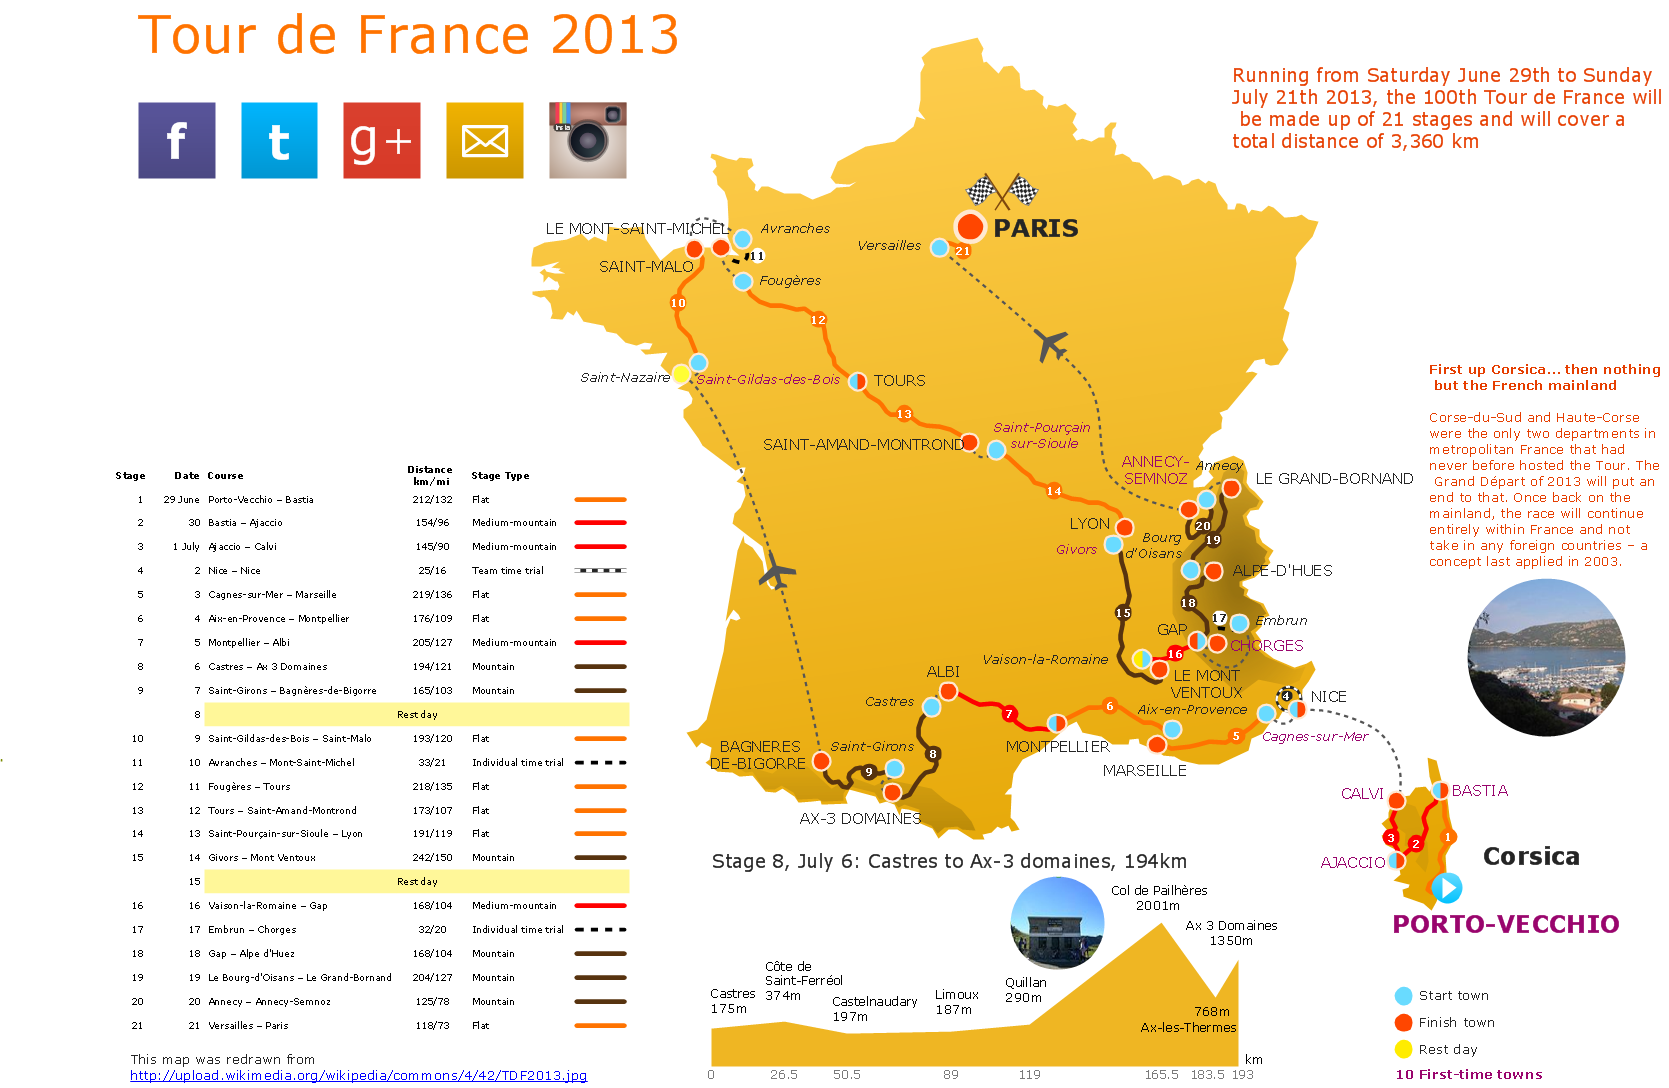
Picture: Travel Infographics
Infographic is a visual way of representing various information, data, knowledge in statistics, geography, journalism, education, and much more areas. ConceptDraw DIAGRAM supplied with Pictorial Infographics Solution from the “Infographics” Area, provides a set of powerful pictorial infographics tools. Thanks to them it is the best Infographic Maker.
Picture: Infographic Maker
Related Solution:
Users new to ConceptDraw PROJECT will find the Basic lessons an essential platform for familiarizing themselves with the program′s functions. Learn how to assign resources to tasks in ConceptDraw PROJECT with this comprehensive video lesson.
Picture: Project — Assigning Resources
Related Solutions:
The Ishikawa diagram, Cause and Effect diagram, Fishbone diagram — all they are the names of one and the same visual method for working with causal connections. Originally invented by Kaoru Ishikawa to control the process quality, the Ishikawa diagram is well proven in other fields of management and personal scheduling, events planning, time management. It is a chart in the form of a fish, whose head is a problem, the fins are variants for its causes.
To design easily the Fishbone diagram, you can use a special ConceptDraw DIAGRAM vector graphic and diagramming software which contains the powerful tools for Fishbone diagram problem solving offered by Fishbone Diagrams solution for the Management area of ConceptDraw Solution Park.
Picture: Fishbone Diagram Problem Solving
Related Solution:
ConceptDraw Wireless Network solution includes 81 of professional-looking stencils and several samples that you can modify and make your own diagram.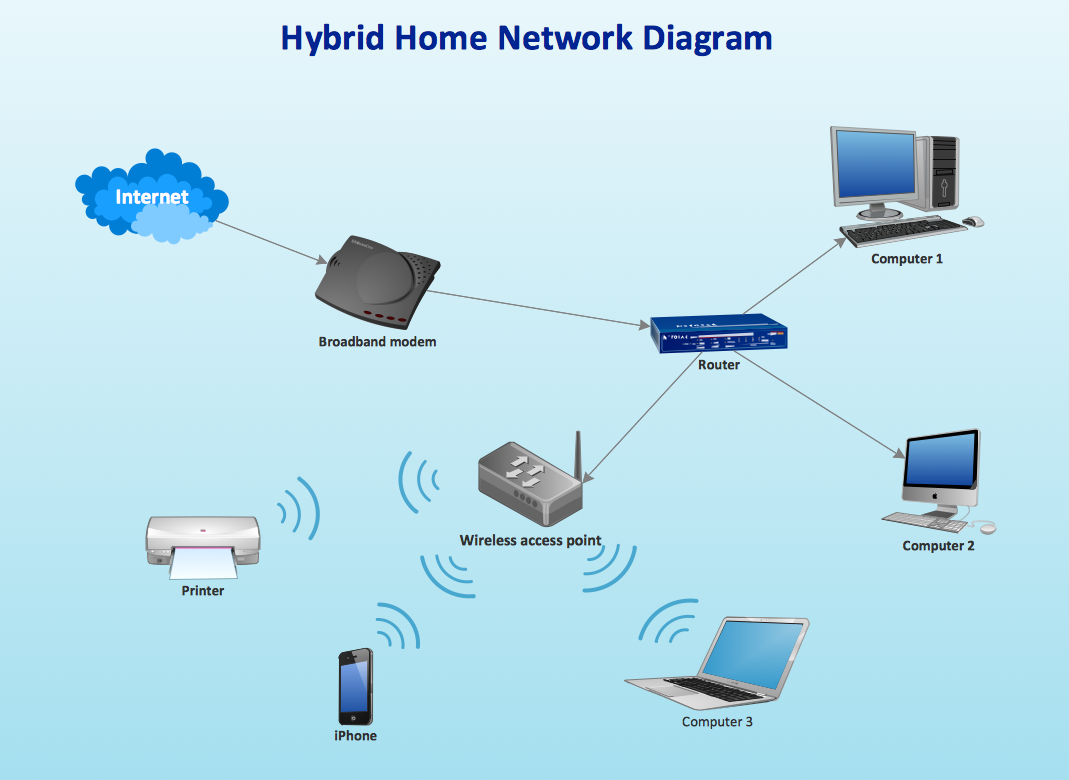
Picture: How to Create Network Diagrams
Related Solution: