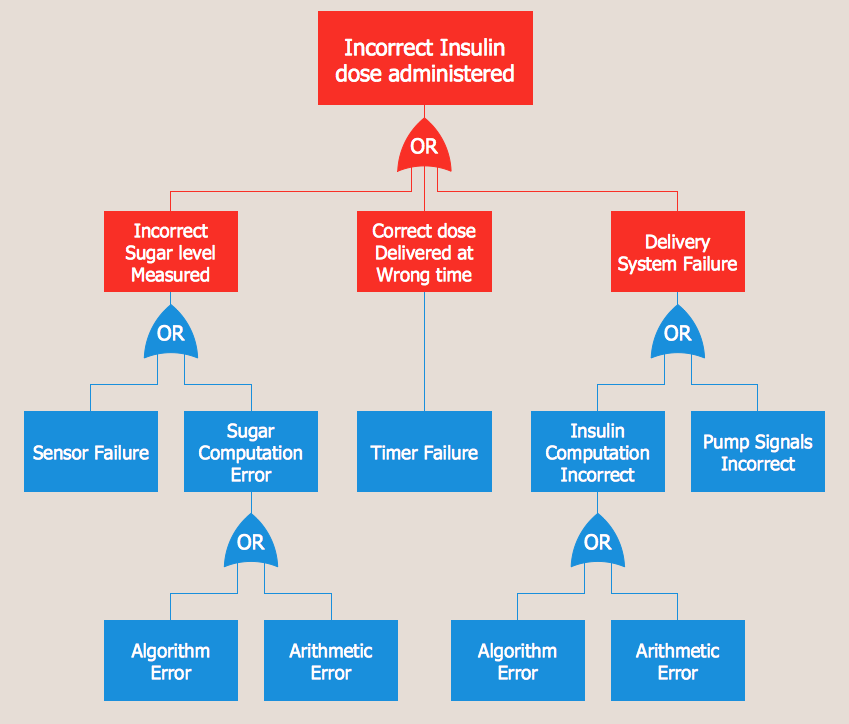
Example 1. Fault Tree Analysis Example
Fault Tree Analysis Diagrams Solution is rich for predesigned samples, templates, and ready-to-use vector elements developed and grouped in Fault Tree Analysis Diagram library.

Example 2. Fault Tree Analysis Diagram Library Design Elements
Variety of samples is available from ConceptDraw STORE. Any Fault Tree Analysis example or template included in Fault Tree Analysis Diagrams Solution can be used as the base for quickly design your own FTA Diagram.

Example 3. Fault Tree Analysis Diagram Template
The Fault Tree Analysis example and template you see on this page were created in ConceptDraw DIAGRAM using the Fault Tree Analysis Diagrams Solution. You can find them in Fault Tree Analysis Diagrams section of ConceptDraw STORE.
Use the Fault Tree Analysis Diagrams Solution for ConceptDraw DIAGRAM software to create your own professional looking Fault Tree Analysis Diagrams quick, easy and effective.
All source documents are vector graphic documents. They are available for reviewing, modifying, or converting to a variety of formats (PDF file, MS PowerPoint, MS Visio, and many other graphic formats) from the ConceptDraw STORE. The Fault Tree Analysis Diagrams Solution is available for all ConceptDraw DIAGRAM or later users.
FIVE RELATED HOW TO's:
Analyze the root causes of factors that influence the problem. A diagram is constructed separately for each high priority factor. Identify the root causes for a factor and then propose possible corrective actions. The diagram displays the structure of causes for a factor and possible corrective actions. The Root Cause Analysis Tree Diagram is used for further formulation of actions.
Picture: Root Cause Tree Diagram
Related Solution:
ConceptDraw DIAGRAM is a powerful drawing and vector diagram maker software that allows to design the professional looking Influence Diagrams quick and easy.
Picture: Influence Diagram Software
Related Solution:
If you ever wanted to try any diagramming tools except of Visio, but were afraid to lose existing documents, there’s good news for you. One of the most striking features of ConceptDraw DIAGRAM is it’s perfect compatibility with MS Visio, which guarantees that you won’t depend on operating system anymore, because another ConceptDraw DIAGRAM feature is that it’s cross-platform tool. Don’t waste your time looking for other options, you’ve found the solution already!
Business professionals often utilize the MS Visio as a common tool for making various issues on business visualization. MS Visio is a strong software with good capacity to maintain complex business solutions. But there is no MS Visio for Apple OS X. This is a large invocation, and one would be pleased to recognize that ConceptDraw DIAGRAM is the ideal alternative to MS Visio. Primarily, because this software works natively on both Windows and Apple OS X platforms. if you have migrated from Windows to Mac, or need to communicate in a cross-platform conditions, you’ll search for MS Visio replacer. ConceptDraw DIAGRAM is the exclusive professional business diagramming application that runs on both Windows and Apple OS X. The opportunity exchange files between PC and Mac, as well as between ConceptDraw DIAGRAM and Visio is the significant advantage that permits you to display and to collaborate business information in effortless and cost-effective way.
Picture: ConceptDraw DIAGRAM Compatibility with MS Visio
ConceptDraw DIAGRAM diagramming and vector drawing software extended with Site Plans Solution from the Building Plans Area of ConceptDraw Solution Park is a powerful Site Plan Software.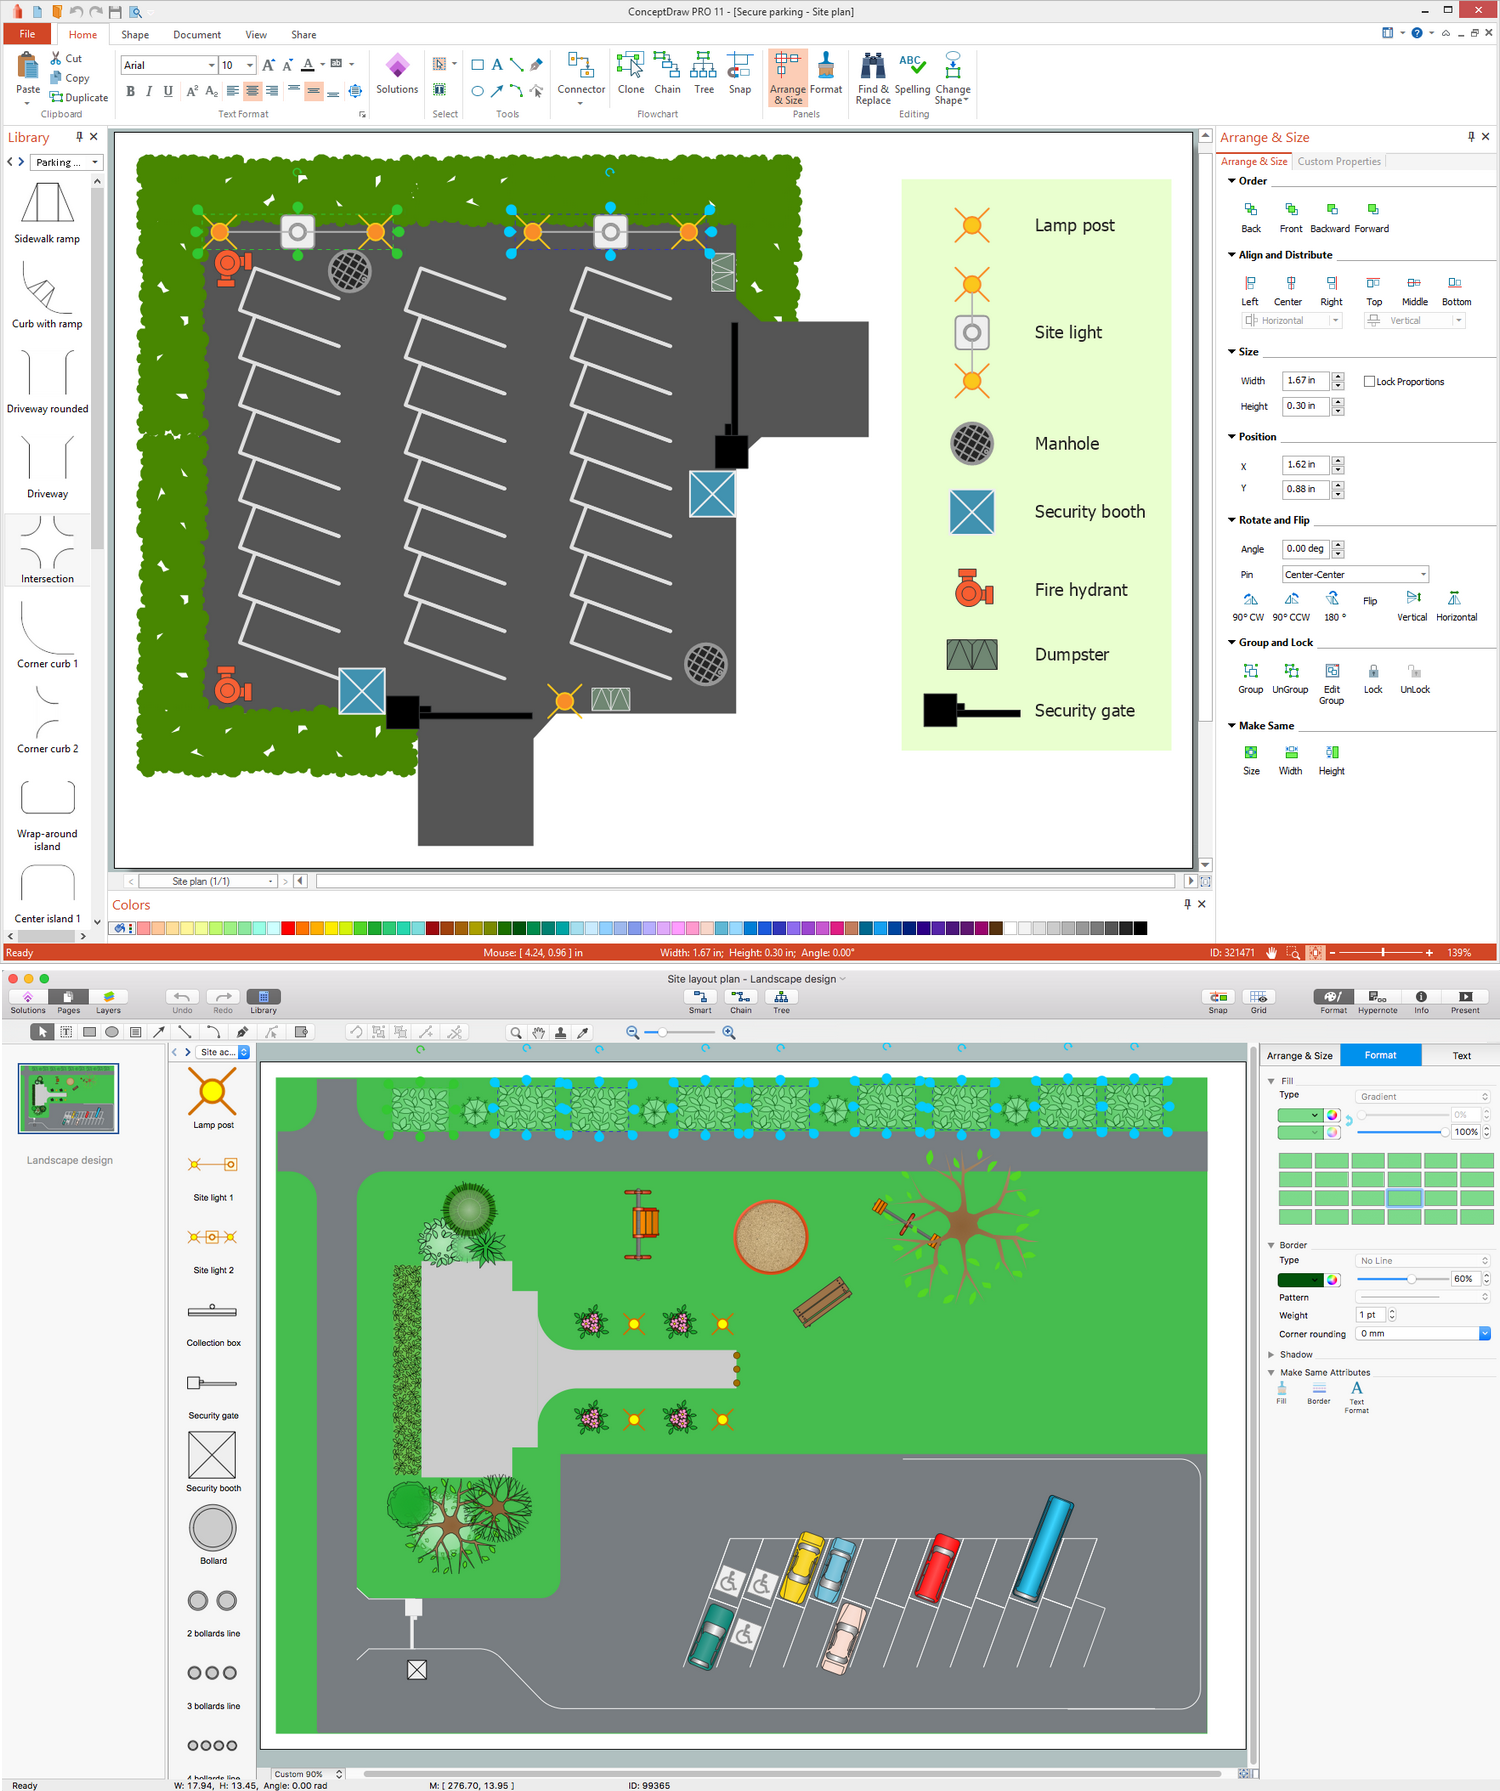
Picture: Site Plan Software
Related Solution:
The library with 40 vector stencils is included in the ConceptDraw Value Stream Mapping solution.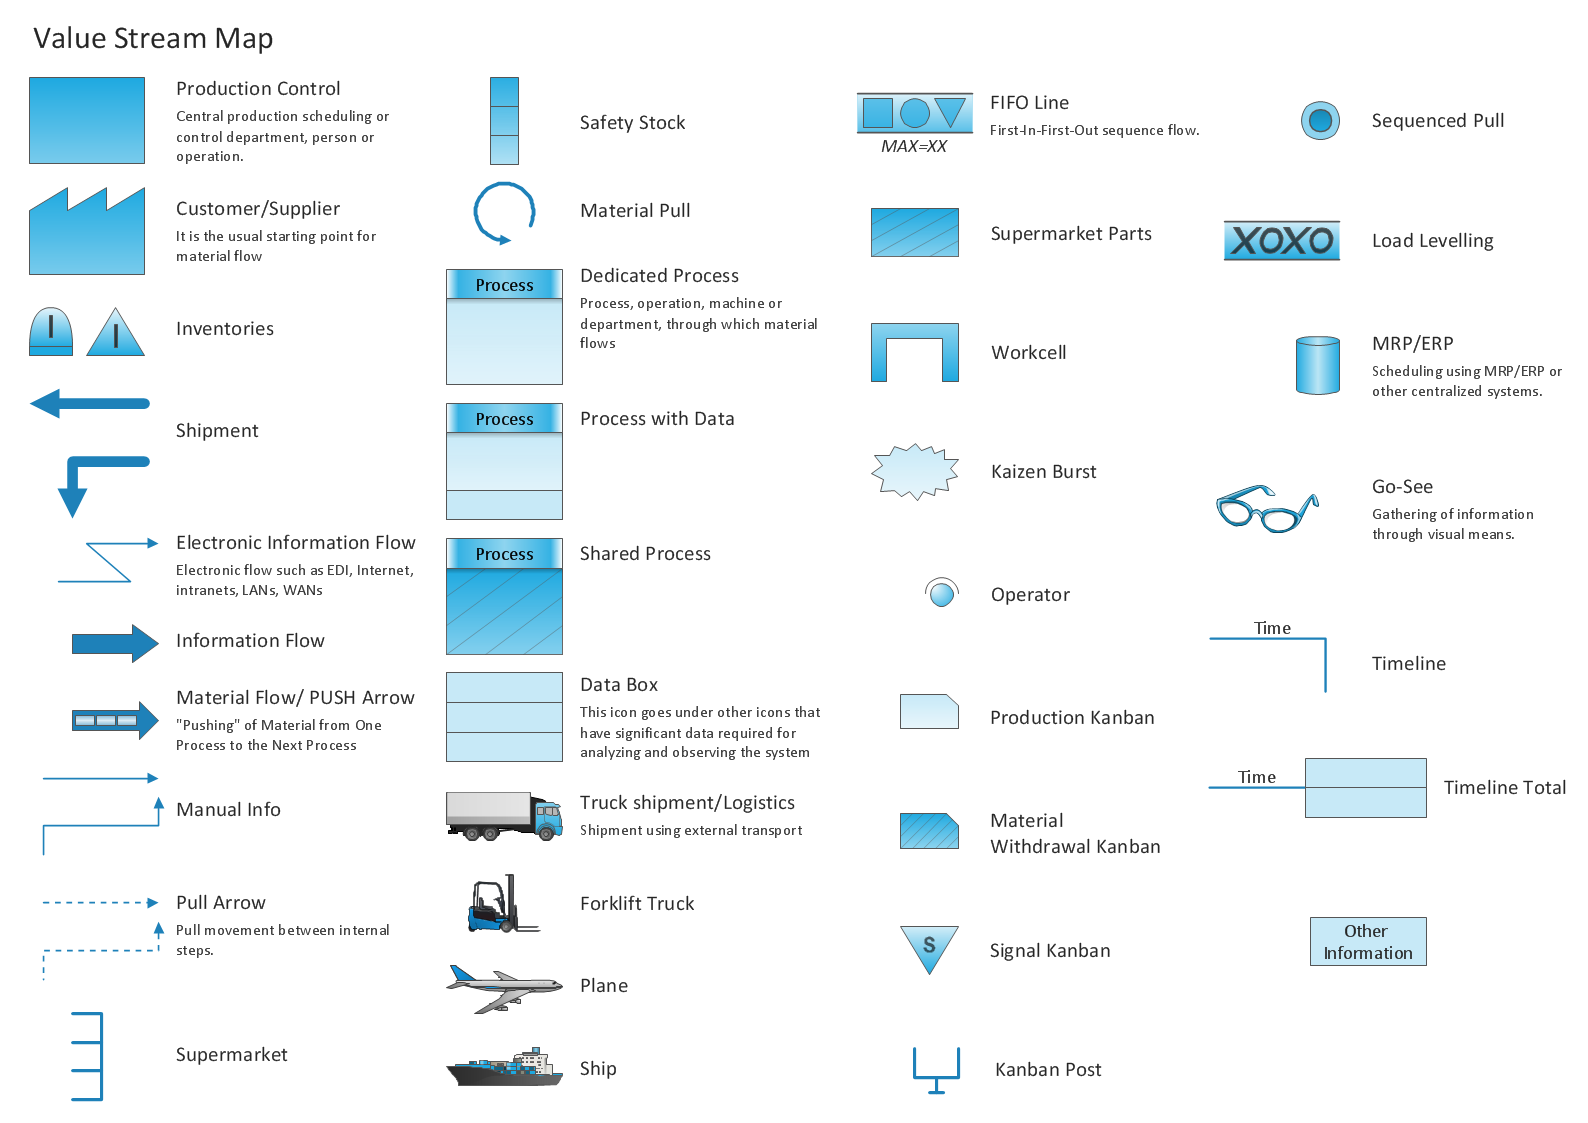
Picture: Value Stream Mapping Icons
Related Solution:

