Hotel Network Topology Diagram
Network Topology Diagram
Network topology is used for arranging the various elements, such as nodes, links and other, of some computer network. Network topology is the topological structure of some network and it may be depicted both logically or physically. Physical topology can be referred to the placement of the network's components, such as device location and cable installation. Logical topology shows the way some data flows within one network. Distances between the transmission rates, nodes, physical interconnections and signal types may be different between two different networks, but the topologies of both networks may be the same.
There are eight basic topologies, which can be used nowadays and they are “Point-to-point” one, “Bus” topology, “Star” one, “Ring or circular”, “Mesh” one, “Tree” topology, “Hybrid” one and the topology called “Daisy chain”. Each of them will be described later in this article.
Thus, point-to-point topology is the simplest one with a dedicated link between two endpoints. There is a point-to-point communications, which appears to be associated with the two endpoints.
There is one of the most commonly used computer network topologies – bus network topology. Bus networks are well known for their nodes being located in a shape of a bus and the way such networks look reminds of a bus, as the nodes in it are connected to one common linear, which is called a bus. In this type of topology diagram of a form of a bus everyone can see both the linear, the nodes and them directly connected to that linear.
There is a host on a bus in the bus topology diagram, which is called a “Station”. It can also be called as a “Workstation”. Every of the “stations” or “workstations” receive all of the network traffic which is generated by each of such stations and has equal transmission priority. The nodes in such topology transmit the data at the same time as they work simultaneously by using the so called media access control technology. The example of such media access control technology can be a carrier sense multiple access as well as a bus master.
Star networks are well known for their nodes being located in a shape of a star. There are one of the most commonly used computer network topologies – star network topologies. The way such networks look reminds of a star as there is a central node which is illustrated in the very middle of the network schematics and from this central hub there are other nodes all around this hub connected to it. The central hub is there to transmit the messages to the other nodes and it is the server itself when the peripheral nodes are the clients.
Having such a hub in your star topology diagram, as well as the leaf nodes, which are connected to it all together with the transmission lines between all of them, you can illustrate all that in a way of a network topology which will be called the start network topology diagram. In this diagram of a form of a star everyone can clearly see both the central hub, the nodes and the lines which connect these nodes to the middle where the hub is. The data is meant to be going through the hub, or the switch (also known as concentrator), before it can finish its way until it gets to its destination.
The main function of the hub in the star topology is to control and message all of the functions of the network. It can also be in charge for repeating the data flow. Such configuration can be made with use of the twisted pair cable as well as the optical fibre cable. A coaxial cable can also be used.
A ring topology is same as a bus topology in a closed loop. Data in such topology travels around that ring in only one direction. When one node sends data to another one, this data passes through each intermediate node on the ring until it reaches its planned destination. The intermediate nodes transmit this data to keep the signal strong and every node is a peer, and there is no hierarchical relationship of servers or clients in this topology. If one node is unable to transmit data, then it severs communication between the nodes, which stand before and after it in the bus within this bus topology. There are a few advantages of using such topology, which can be useful in case the load on the network increases, its performance is better than bus topology and also for another reason that there is no need of network server to control the connectivity between the different workstations.
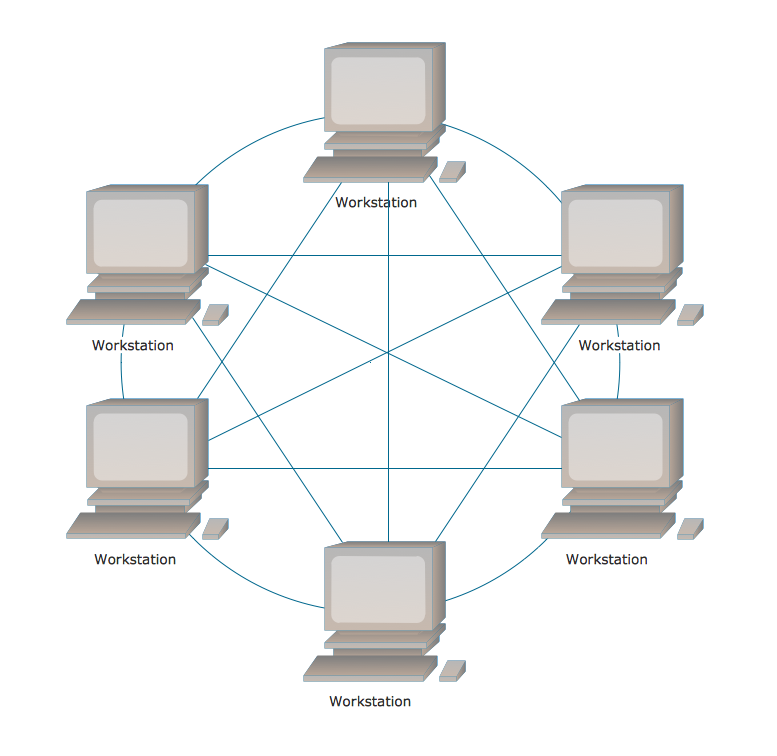
Mesh network is the one also known as a network topology where nodes relay data for the network. All of the nodes co-operate in the process of the distribution of the data in the network. This type of topology can be used for both wired and wireless networks, although wireless mesh networks can be considered a type of wireless ad hoc network, so wireless mesh networks are related to the mobile ad hoc networks or MANETs. MANETs are not restricted to a specific mesh network topology, so Wireless ad hoc networks or MANETs can take any form of network topology.
Hybrid network topologies are those, which combines a few different type of topologies, for instance, the mesh one and the star topology, or the bus network and star network topology, and vice versa. Although, a tree network, which is connected to another tree network, is still a tree network, but not a distinct network type. A hybrid topology is always illustrates two different basic network topologies, which are both connected to each other.
Except for star-based networks, the easiest way to add more computers into a network is by daisy-chaining or connecting each computer to the next one. A daisy-chained network can be a linear and a ring one. A linear network topology has a two-way link between one computer and the next. And a ring one is used for connecting the computers at each end, which advantage is the fact, that the number of transmitters and receivers can be cut in half.
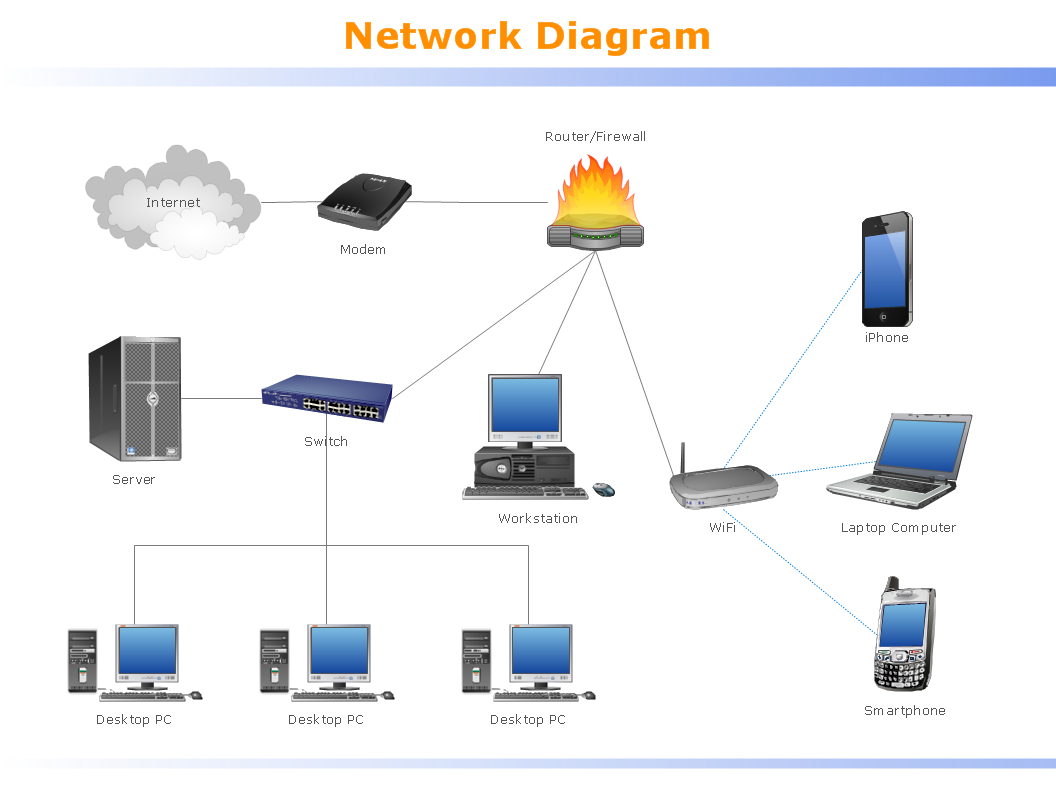
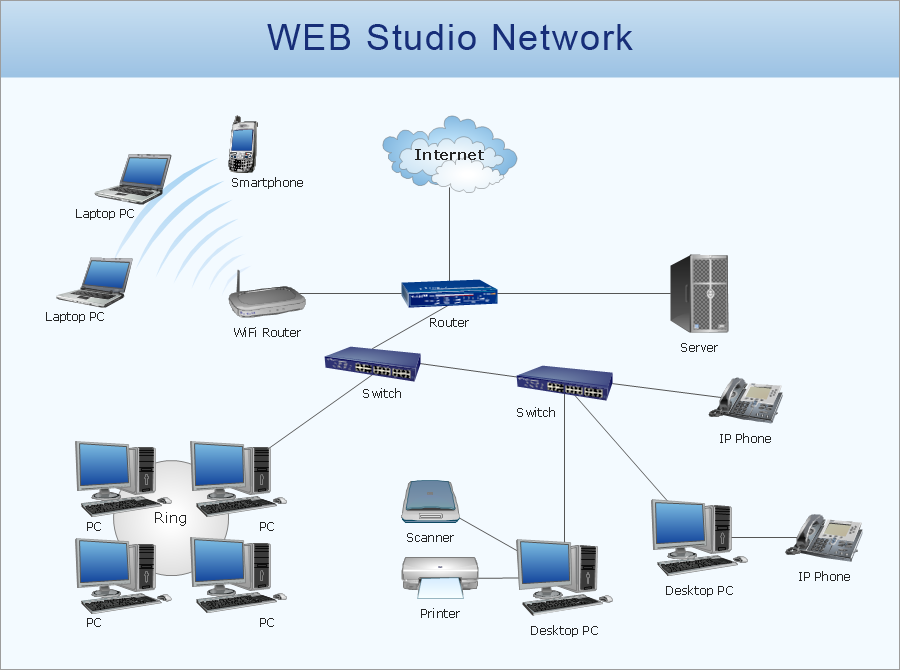
If you need to create any of mentioned above network topology diagram, for your house, office or even your own hotel or if you work in somebody else’s hotel, then you can create any diagram within only a couple of hours, or even minutes using the ConceptDraw DIAGRAM application as well as “Computer and Networks” solution from Computer and Networks area of ConceptDraw Solution Park that offers a huge number of various templates and libraries with objects of local area network (LAN) and wireless LAN (WLAN) equipment. This solution can also be found in ConceptDraw STORE application and you can always use it for drawing the physical and logical network topology diagrams for wired and wireless computer communication networks.
Use it to draw the physical and logical network topology diagrams for wired and wireless computer communication networks.
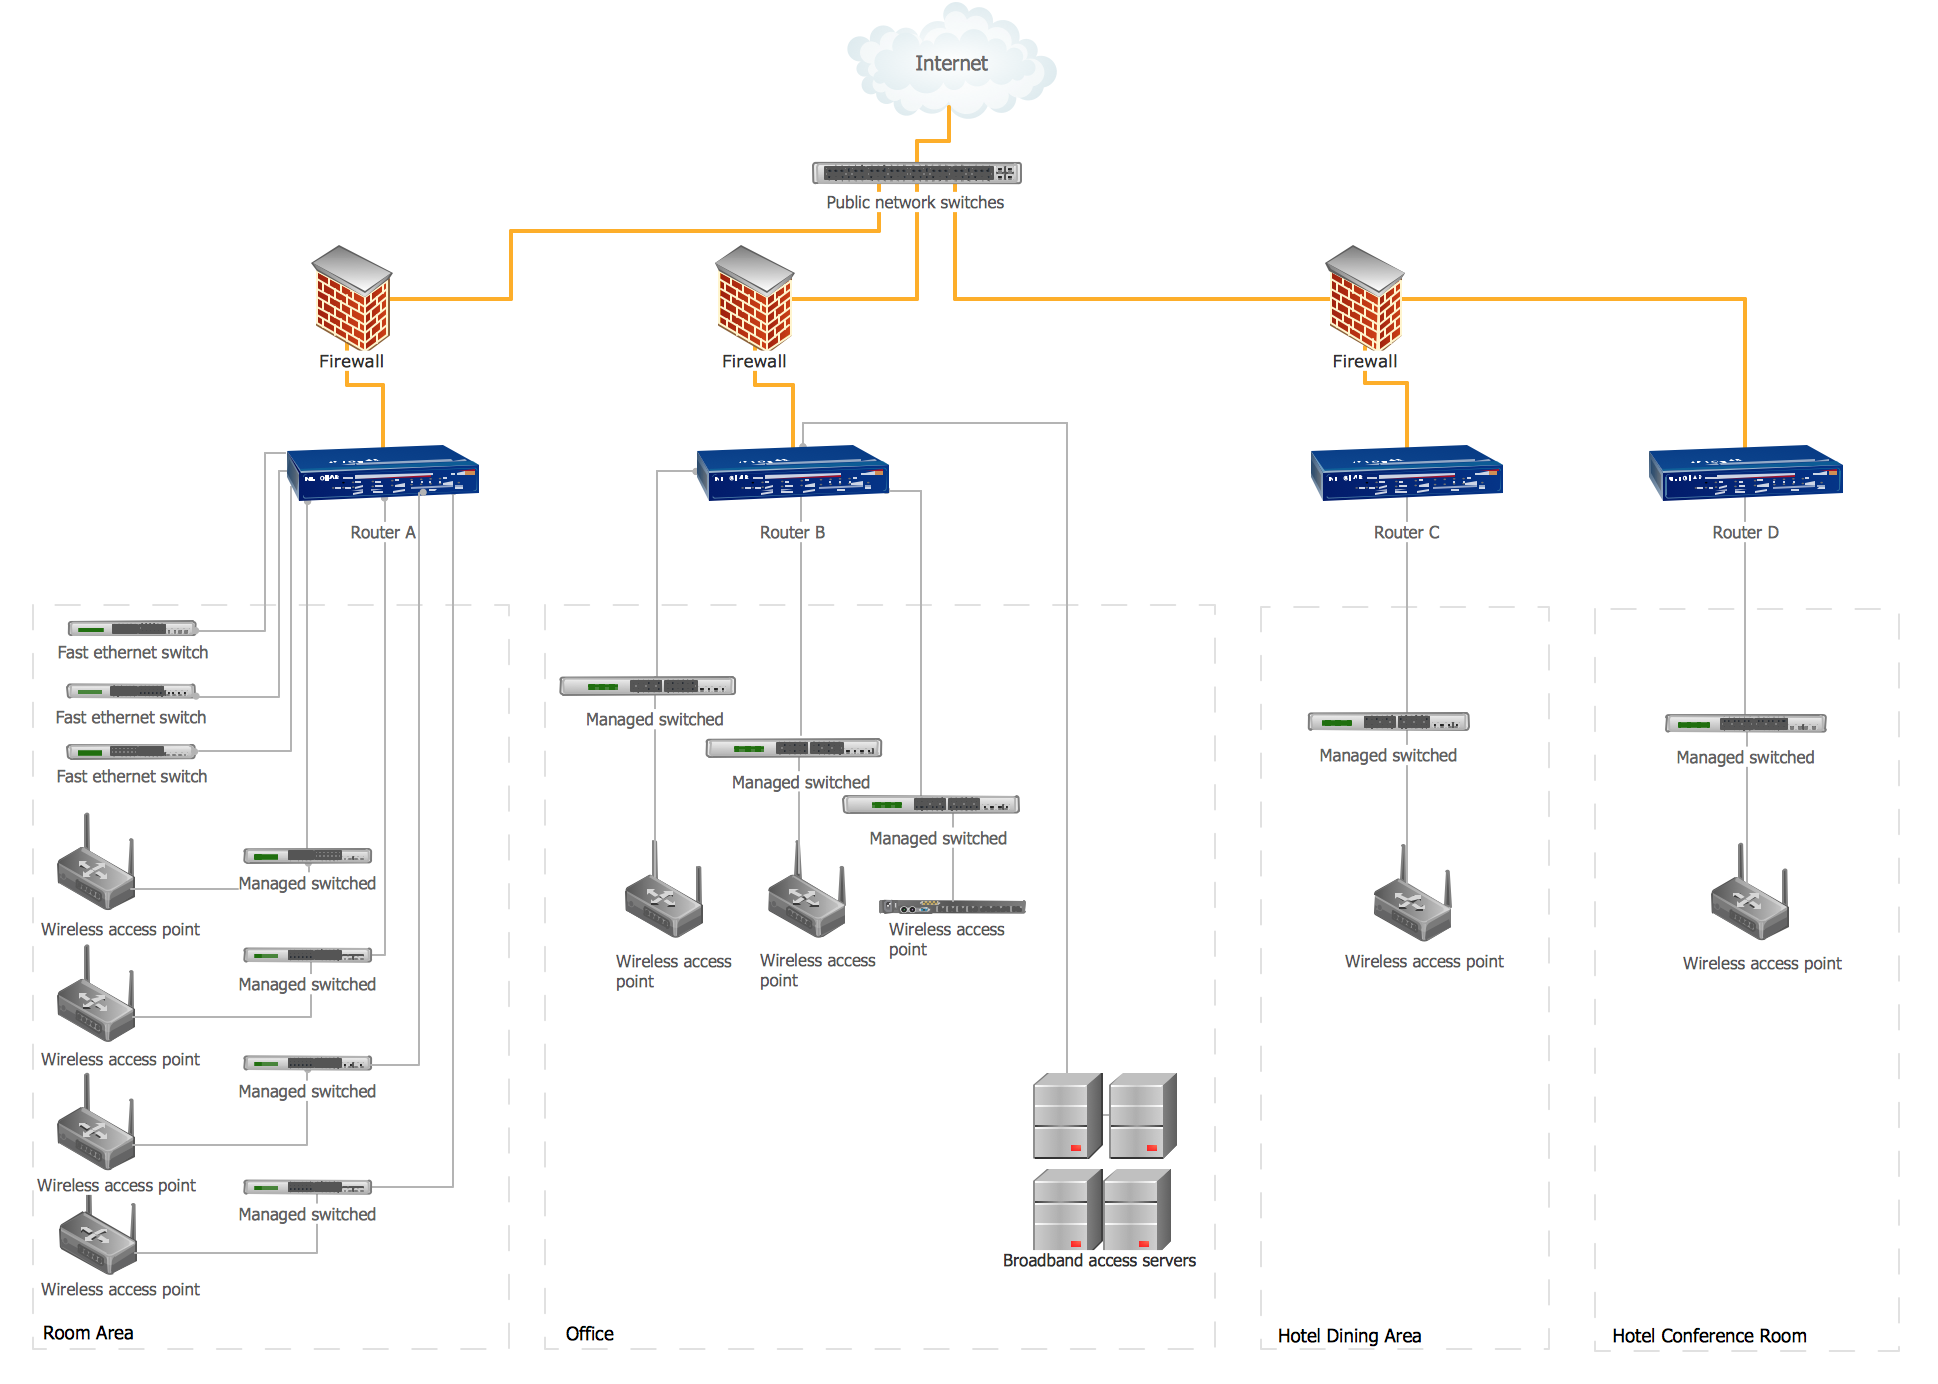
Sample 1. Hotel Network Topology Diagram
This example of computer network topology diagram shows hotel WLAN containing the firewalls, routers, switches, wireless access points and broadband access servers.