
Example 1. Project Timeline
How many useful tools offers the Timeline Diagrams Solution for project timeline creating! These are extensive drawing tools, the Timelines and Milestones library with set of predesigned vector shapes, and also collection of templates and samples.

Example 2. Timeline Diagrams Solution in ConceptDraw STORE
Timeline template is an excellent start for drawing project timeline diagrams, it is convenient for use and help save your time. You can open it from ConceptDraw STORE.

Example 3. Timeline Diagram - Project Schedule
The samples you see on this page were created in ConceptDraw DIAGRAM software with help of Timeline Diagrams Solution. An experienced user spent 10 minutes creating each of these project timeline diagrams.
Use the Timeline Diagrams Solution to create your own project timeline diagram of any complexity quick, easy and effective.
All source documents are vector graphic documents. They are available for reviewing, modifying, or converting to a variety of formats (PDF file, MS PowerPoint, MS Visio, and many other graphic formats) from the ConceptDraw STORE. The Timeline Diagrams Solution is available for all ConceptDraw DIAGRAM or later users.
TEN RELATED HOW TO's:
UML Apartment Plan. This sample was created in ConceptDraw DIAGRAM diagramming and vector drawing software using the UML Class Diagram library of the Rapid UML Solution from the Software Development area of ConceptDraw Solution Park.
This sample show the detailed plan of the apartment and is used by building companies, design apartments, real estate agencies, at the buying / selling of the realty.
Picture: UML Class Diagram Example - Apartment Plan
Related Solution:
Use ConceptDraw DIAGRAM diagramming and business graphics software for drawing your own PM life cycle flow charts.
Picture: Program to Make Flow Chart
Related Solution:
Use ConceptDraw DIAGRAM software with Flowcharts Solution to create Process Flow Charts, Flow Chart Process Maps, and High-Level Process Flow Charts to illustrate ✔️ high-level processes in industrial, chemical, and process engineering, ✔️ major plant processes, ✔️ minor details
Picture: Process Flow Chart
Related Solution:
ConceptDraw PROJECT is simple project scheduling software delivering the full range of classic project reports about statuses and resorces usage. Learn how features of project gantt charts works in simple ConceptDraw PROJECT scheduling software, how to export project management dashboard in excel representation.
Picture: Gantt charts for planning and scheduling projects
It is so simple making the drawing process easier and faster. you just need to choose the right drawing software.
ConceptDraw Arrows10 Technology - This is so easy and fast to draw any type of diagram with any degree of complexity.
Picture: Simple & Fast Diagram Software
Related Solutions:
When trying to figure out the nature of the problems occurring within a project, there are many ways to develop such understanding. One of the most common ways to document processes for further improvement is to draw a process flowchart, which depicts the activities of the process arranged in sequential order — this is business process management. ConceptDraw DIAGRAM is business process mapping software with impressive range of productivity features for business process management and classic project management. This business process management software is helpful for many purposes from different payment processes, or manufacturing processes to chemical processes. Business process mapping flowcharts helps clarify the actual workflow of different people engaged in the same process. This samples were made with ConceptDraw DIAGRAM — business process mapping software for flowcharting and used as classic visio alternative because its briefly named "visio for mac" and for windows, this sort of software named the business process management tools.
This flowchart diagram shows a process flow of project management. The diagram that is presented here depicts the project life cycle that is basic for the most of project management methods. Breaking a project into phases allows to track it in the proper manner. Through separation on phases, the total workflow of a project is divided into some foreseeable components, thus making it easier to follow the project status. A project life cycle commonly includes: initiation, definition, design, development and implementation phases. Distinguished method to show parallel and interdependent processes, as well as project life cycle relationships. A flowchart diagram is often used as visual guide to project. For instance, it used by marketing project management software for visualizing stages of marketing activities or as project management workflow tools. Created with ConceptDraw DIAGRAM — business process mapping software which is flowcharting visio alternative or shortly its visio for mac, this sort of software platform often named the business process management tools.
Picture: Process Flowchart: A Step-by-Step Comprehensive Guide
Related Solution:
Project timeline is a type of chart which allows visually represent the chronology of works for the project, placing the key points of the project (milestones) on a timescale.
You need to make professional looking project timeline? Create it with ConceptDraw DIAGRAM! ConceptDraw DIAGRAM extended with Timeline Diagrams Solution from the Management Area is the best timeline diagrams softwarePicture: Project Timeline
Related Solution:
Timeline is a powerful tool for project management and project scheduling, it is a convenient way to represent a chronological sequence of events and critical milestones along a time axis. Timeline allows quickly understand the temporal relationships and to see the progress of a project schedule.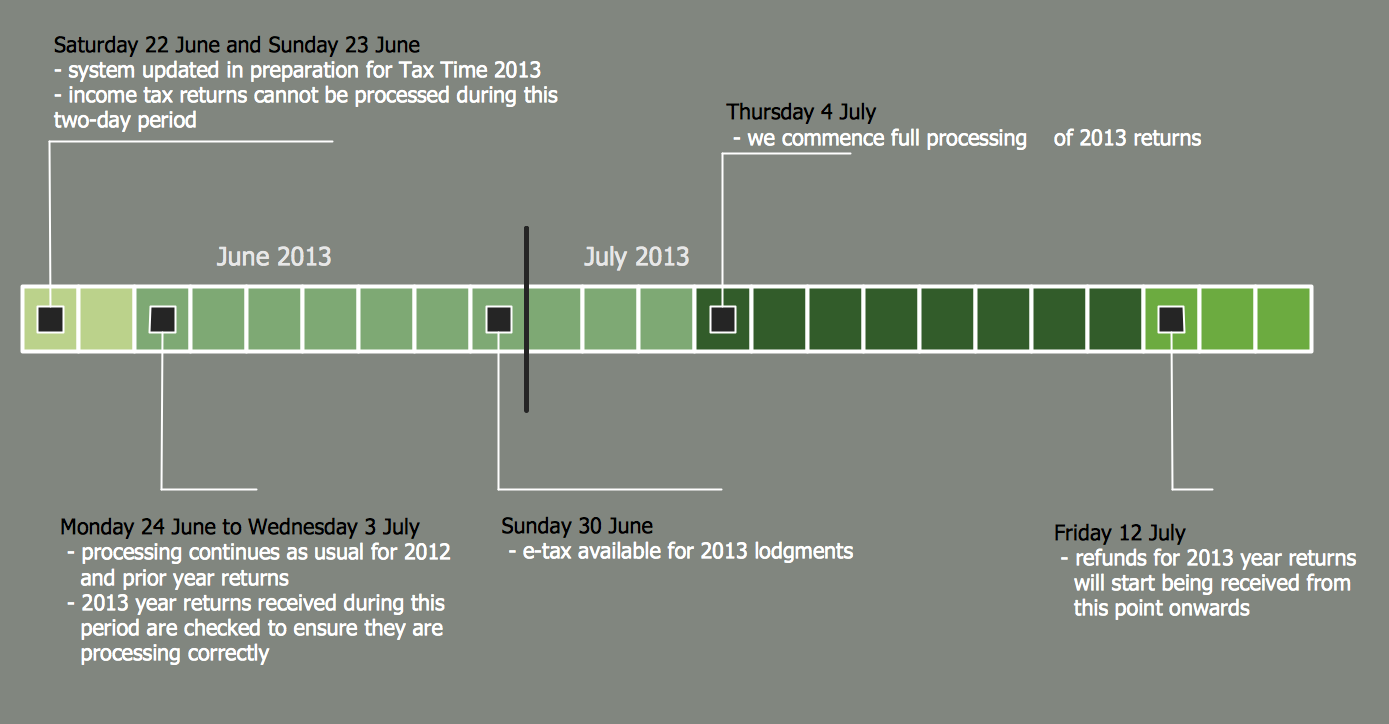
Picture: Timeline Diagrams
Related Solution:
Starting producing workflow diagram from template you save time and avoid the blank page syndrome. At first, the workflow template is set of rules for a workflow. The workflow symbols used in the specific case are part of workflow template. This is the subset of large standard collections of workflow symbols. The first part of workflow template is identification of symbols allowed in use in your specific case. The best way would be to collect them in your customized drawing collection of workflow symbols which used in your specific cases of workflow diagrams. Another way to create business process documents is using business process flow diagram which have similar purposes and have different visual notation.
ConceptDraw DIAGRAM is professional workflow diagram software with the rich extentions from ConceptDraw Solution Park. The basic solution for workflow diagramming is Workflow Diagrams Solution. It delivers a rich set of workflow diagram templates and samples help you draw diagrams e
Picture: Workflow Diagram Template
Related Solution:
Automatically create a presentation-quality diagram in one click with ConceptDraw DIAGRAM.
Picture: Visual Presentations Made Easy with Diagramming Software
Related Solution:

