
Examples. Flow Chart Diagrams
Flowchart diagrams are widely used for designing, documenting, analyzing and managing the complex processes, and programs in various fields such as education, business, software development, analytics, engineering, architecture, science, manufacturing, and administration.
The Flowcharts Solution for ConceptDraw DIAGRAM is a comprehensive set of examples and samples in several different color themes for professionals that need to graphically represent a process. Solution value is added by basic flow chart template and shapes' library of Flowchart notation. ConceptDraw DIAGRAM flow chart creator lets one depict a processes of any complexity and length, as well design of the flowchart either vertically or horizontally.
Example. Create Flowcharts & Diagrams with ConceptDraw DIAGRAM (Mac, PC)
Draw your own business process flowcharts using ConceptDraw DIAGRAM diagramming and business graphics software.
TEN RELATED HOW TO's:
ConceptDraw the easy flowchart software that gives users the ability to draw any type of flowcharts. Fast visualization of the structured data with the vector stencils from object libraries by using RapidDraw technology.
Picture: Easy Flowchart Software
Related Solution:
Starting producing workflow diagram from template you save time and avoid the blank page syndrome. At first, the workflow template is set of rules for a workflow. The workflow symbols used in the specific case are part of workflow template. This is the subset of large standard collections of workflow symbols. The first part of workflow template is identification of symbols allowed in use in your specific case. The best way would be to collect them in your customized drawing collection of workflow symbols which used in your specific cases of workflow diagrams. Another way to create business process documents is using business process flow diagram which have similar purposes and have different visual notation.
ConceptDraw DIAGRAM is professional workflow diagram software with the rich extentions from ConceptDraw Solution Park. The basic solution for workflow diagramming is Workflow Diagrams Solution. It delivers a rich set of workflow diagram templates and samples help you draw diagrams e
Picture: Workflow Diagram Template
Related Solution:
Mathematical Drawing Software - Draw mathematical illustration diagrams easily from examples and templates!
Picture: Basic Diagramming
Related Solution:
ConceptDraw DIAGRAM diagramming and vector drawing software extended with tools of Flowcharts Solution from the Diagrams Area of ConceptDraw Solution Park ideally suits for fast and easy Online Flow Chart designing. We propose to verify this right now.
Picture: Online Flow Chart
Related Solution:
Data base diagrams describes inter-related data and tables. It describes roles and relationships, internal and external dependencies, data exchange conventions and structures of knowledge domain.
ConceptDraw Software provides number of data-base chart libraries including major 49 vector symbols. Use these DFD flowchart symbol libraries to design data-base structure and models, use it to design data base process-oriented models, or simple data-oriented models. The are special drawing tools for making data flowcharts, data process diagrams, structured analysis diagrams, and information flow diagrams.
Picture: Database Flowchart Symbols
Related Solution:
Flowcharts are used to represent accounting information in a system. In ConceptDraw software there are special symbols that are used to create accounting flowcharts.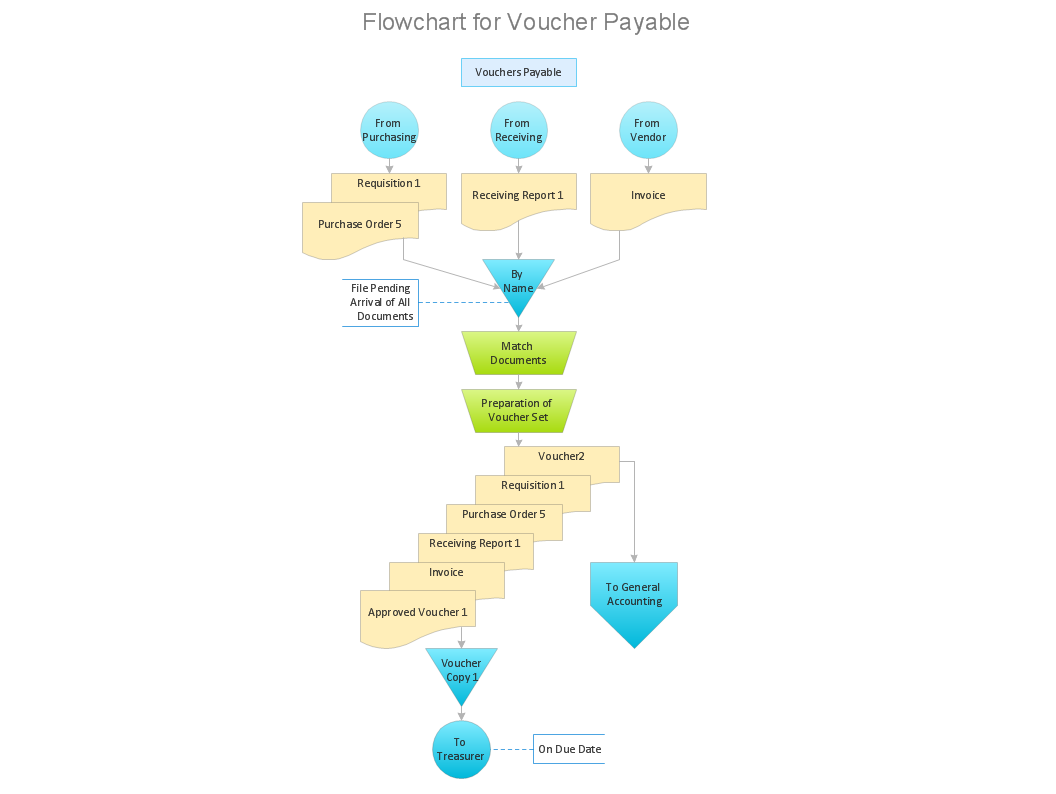
Picture: Why Flowchart is Important to Accounting Information System?
Related Solution:
Diagramming software for Mac and PC - create flowcharts and presentations for Social Media Organizing.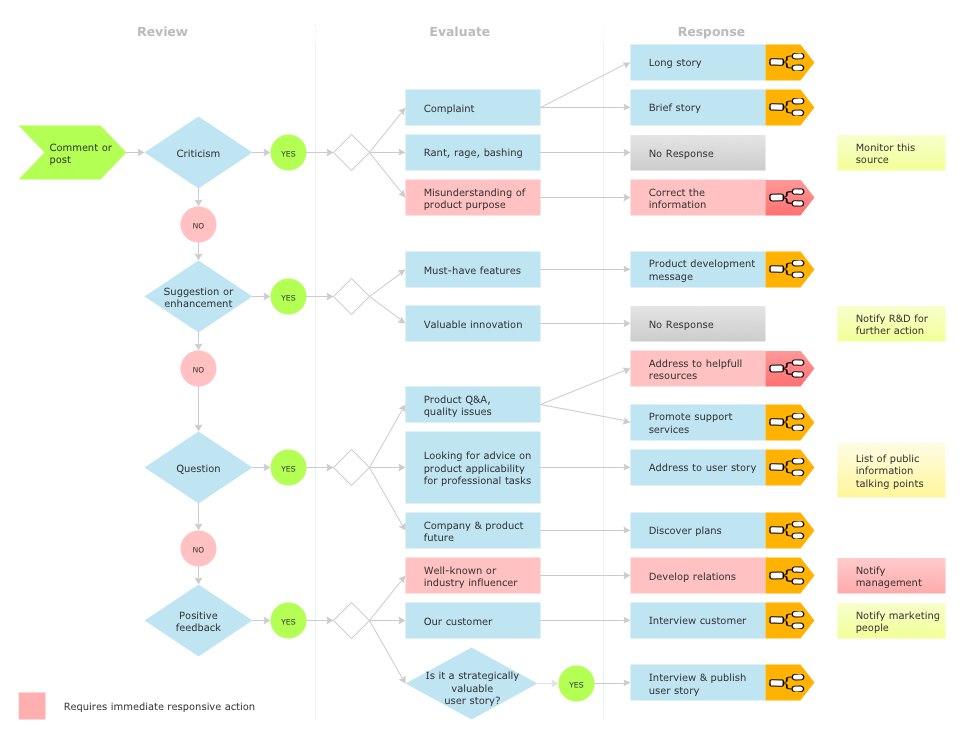
Picture: Social Media Response DFD Flowcharts - diagramming software ( Mac PC )
Related Solution:
Create your own Linux audit flowcharts using the ConceptDraw DIAGRAM diagramming and vector drawing software extended with the Audit Flowcharts solution from the Finance and Accounting area of ConceptDraw Solution Park.
This flowchart example describing auditd, the linux audit tool.
Picture: Linux Audit Flowchart Example. Flowchart Examples
Related Solution:
Diagramming is an astonishing way to visualize business processes. The list of the most common business process flowchart symbols is quite long starting from basic flowcharts, continuing with SIPOC diagrams. Business process modeling was never easier than now, with special ConceptDraw Business Process Mapping solution.
To carry out all professional standard requirements for business processes mapping, it is necessarily to follow the special graphical notations. ConceptDraw Business Process Mapping solution offers an exhaustive suite of tools to aid business process mapping. There are three vector libraries SIPOC Diagrams, Business Process Flowcharts, and Swim Lanes that contains totally more than 50 symbols of standard BPM notations. This is all that professionals need to effectively evaluate and manage quality in business processes.
Picture: Business Process Flowchart Symbols
Related Solution:
If neither of 45 vector shapes of the Cross-Functional Flowcharts solution don't fit your needs, you will want to learn How to create a unique Cross-Functional flowchart.
ConceptDraw Arrows10 Technology - This is more than enough versatility to draw any type of diagram with any degree of complexity.
Drawing software lets you to make horizontal and vertical, audit, opportunity and many more flowcharts.
Picture: How to Create a Cross Functional Flow Chart
