
Sample 1. Cross-functional flowchart
Cross-functional (deployment) flowcharts visualize what functional units (people, departments or functional areas) are responsible for the business process operations.
The flowcharts are divided into rows/columns of functional units. Blocks of various shapes represent the process steps, and are placed in rows/columns of the responsible functional units.
These flowcharts are used to display the relationships of processes and responsible functional units.
ConceptDraw the best business process modeling tool to make flow chart diagrams.
See also Samples:
TEN RELATED HOW TO's:
Constant improvement of key performance indicators that are related to quality is a step in the right direction for a company interested in market growth.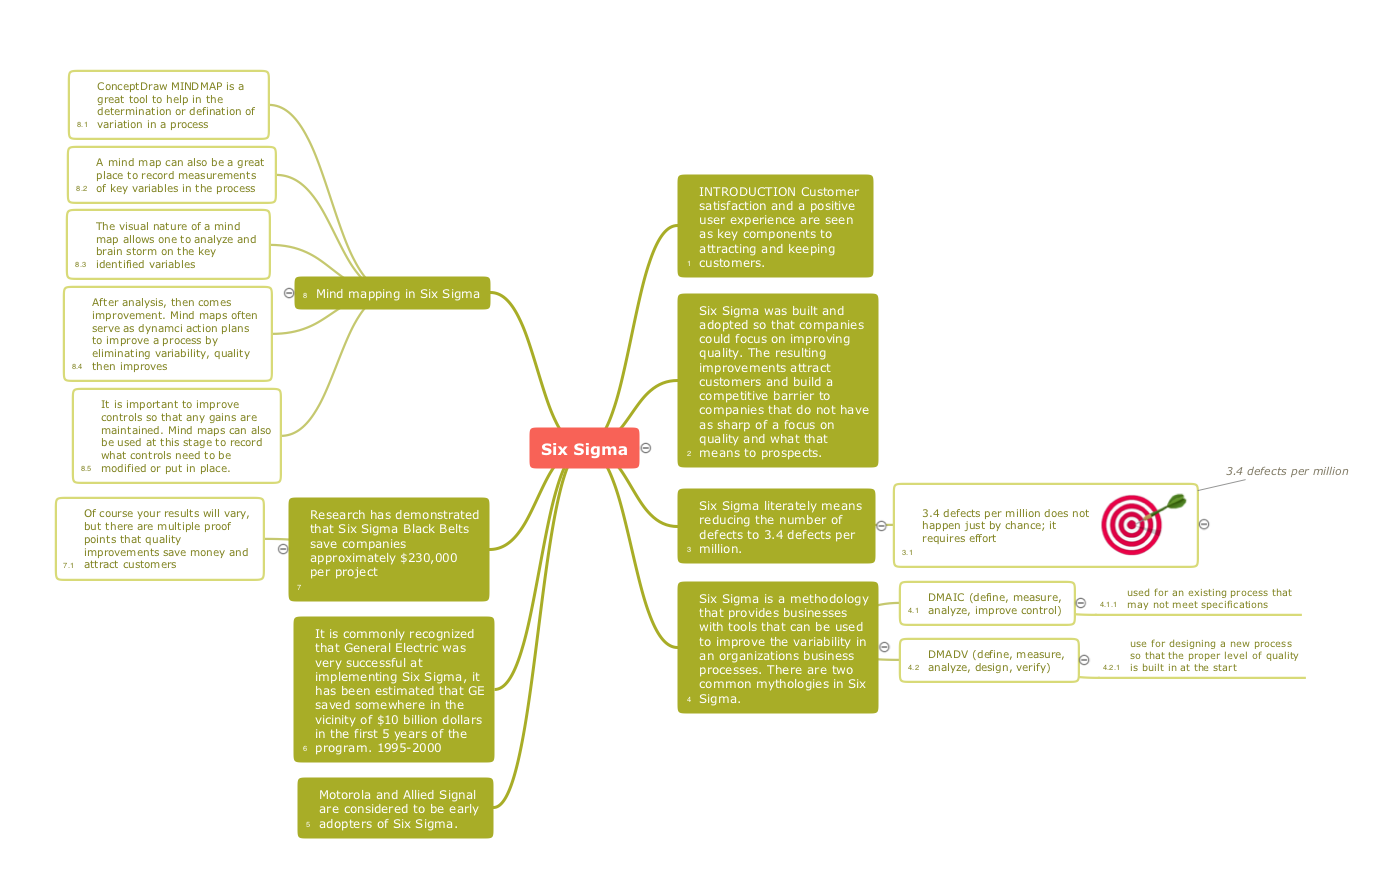
Picture: Quality Improvement
Related Solution:
The Total Quality Management Diagram solution helps you and your organization visualize business and industrial processes. Create Total Quality Management diagrams for business process with ConceptDraw software.
Picture: TQM Diagram Tool
Related Solution:
To draw an effective workflow you have to have an ability to focus on thinking, not drawing. This becomes possible with ConceptDraw DIAGRAM software. Thanks to Arrows10 technology, you are able to place steps and relations onto your workflow diagram without thinking of how to do this, or which stencil to use. This is the most natural and effective way of drawing workflows.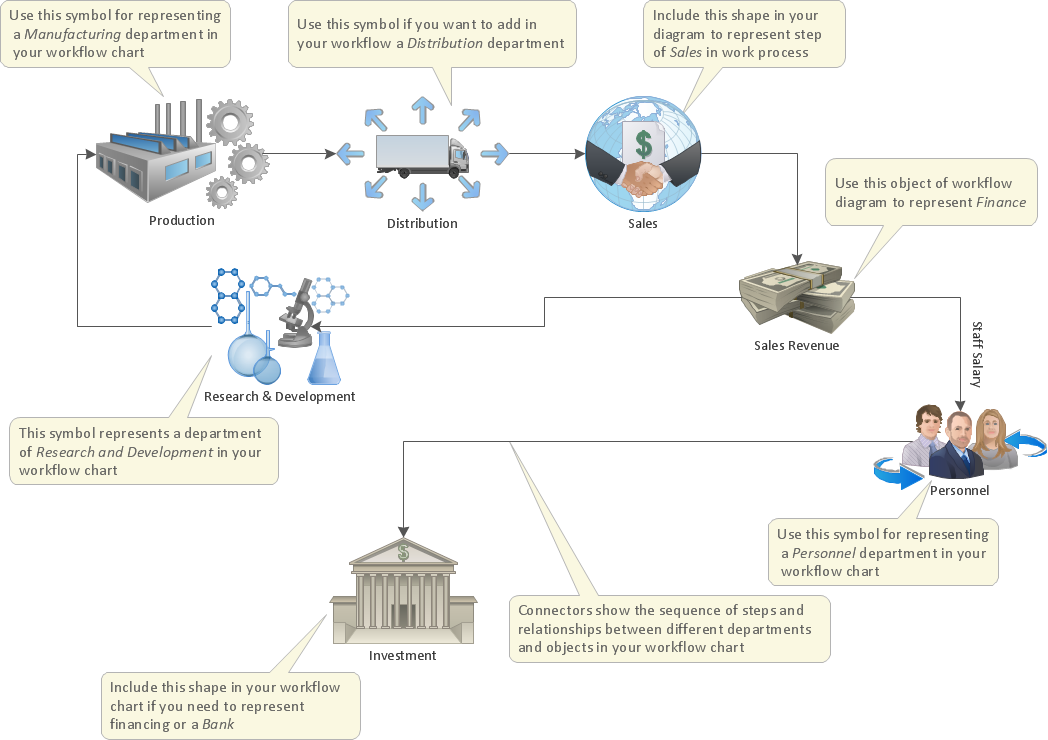
Picture: How to Draw an Effective Workflow
Related Solution:
The Wireless Network solution helps users to quickly transition from an idea to the implementation of a wireless computer network.
ConceptDraw DIAGRAM is well placed to provide experienced and comprehensive assistance in the workplace.
The vector stencils, examples, and templates included to solution is a strong toolset for network engineer.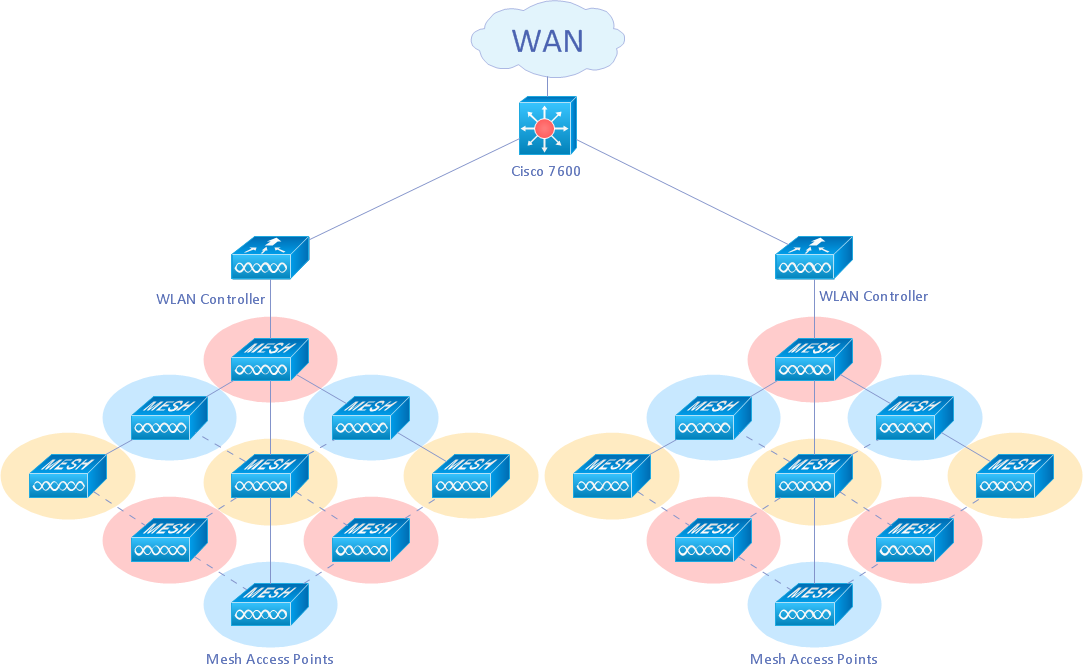
Picture: Wireless Network Drawing
Related Solution:
ConceptDraw DIAGRAM - business process modeling software for mac offers the Business Process Diagram Solution with powerful tools to help you easy represent the business processes and create the business process diagrams based on BPMN 1.2 and BPMN 2.0 standards that allows to create of both simple and complex (nested) models of processes.
There are 16 BPMN 1.2 and BPMN 2.0 stencil libraries containing 230 vector objects: Rapid Draw library, Connections library, Gateways and Artifacts libraries, Data library, Gateways library, Choreographies library, Conversations library, Activities libraries, Events libraries, Expanded Objects libraries, Swim lanes libraries.
Picture: Business Process Modeling Software for Mac
Related Solution:
Big and complex projects sometimes need some simplification of plans and schedules. That's why Program Evaluation and Review Technique was invented and first implemented in 1958. You can create PERT diagrams effortlessly with ConceptDraw DIAGRAM and share them with your colleagues.
Program Evaluation Review Technique (PERT) is a method that is used to assess and analyze projects. PERT is a valuable tool for the project management practice. PERT gives an assessment and analysis of the time needed to the project completion. A PERT chart is a visual tool that delivers a graphical view of a project timeline. It is used to display the sequences and dependences of project tasks necessary to complete a project. ConceptDraw DIAGRAM delivers the possibility to build a PERT along with other diagrams applied to assist management process by using its Seven Management and Planning Tools solution.
Picture: Program Evaluation and Review Technique (PERT) with ConceptDraw DIAGRAM
Related Solution:
Bureaucratic companies usually are characterized by a strict hierarchy and clearly defined responsibilities. However, sometimes organizational structure of a company reminds of somewhat tangled. To clarify it, you can create an orgchart that will represent the company as a tree with its' departments as branches.
This organization diagram represents a tree-like organizational structure. This is a typical example of a top-level branches of the hierarchical organizational structure. This part of the tree shows heads of branches who are subordinated completely to the president. The information and solutions are distributed though a tree structure down to the company's departments. Each of the sub-division has its own structure that is reflected in the corresponding organizational chart. This orgchart diagram was created using the vector graphic library supplied with ConceptDraw Organizational Charts solution.
Picture: Organizational Structure
Related Solution:
ConceptDraw DIAGRAM diagramming and vector drawing software extended with Flowcharts Solution from the 'Diagrams' area of ConceptDraw Solution Park is a powerful tool for drawing Flow Charts of any complexity you need. Irrespective of whether you want to draw a Simple Flow Chart or large complex Flow Diagram, you estimate to do it without efforts thanks to the extensive drawing tools of Flowcharts solution, there are professional flowchart symbols and basic flowchart symbols. This sample shows the Gravitational Search Algorithm (GSA) that is the optimization algorithm.
Picture: Simple Flow Chart
Related Solution:
Risk Diagram (PDPC) - ConceptDraw OFFICE suite is a software for Risks Diagram making. This diagram identifies possible risks in accomplishing corrective actions. With the Risks Diagram, one analyzes each action separately in a tree of all actions and develops a preventive action in response of each potential obstacles or circumstances which may be a risk.
Picture: CORRECTIVE ACTIONS PLANNING. Risk Diagram (PDPC)
ConceptDraw Pyramid Diagram software allows drawing column charts using predesigned objects or drawing tool.
Picture: Fundraising Pyramid
Related Solutions: