Organization Chart Software: A Comprehensive Guide
An Organizational chart or an Org chart is a visual representation of the internal structure of an organization, enterprise, or company. It outlines the hierarchy and relationships among employees, departments, or separate divisions depending on the enterprise's size. The chart typically displays key roles or job titles, reporting relationships, and the flow of authority.
An Organizational chart offers clarity and visibility into the structure, shows how teams and departments are organized. This facilitates communication, enhances accountability, and makes it easier for employees to understand the structure and reporting lines within the business, their functions, responsibilities, roles at the company, and the importance of their work. This clarity and understanding ensure improved operational efficiency, engagement, motivation, and better collaboration among teams in any organization.
An Org chart is a visual tool with various uses, such as planning and managing purposes, budgeting, etc. It is also used as personnel guidance and for many other purposes. Most Org charts are structured using the hierarchical model, but other types, such as flat, matrix, etc., are also used. Additionally, the Company org charts can depict the overall company or be focused on one department or division.

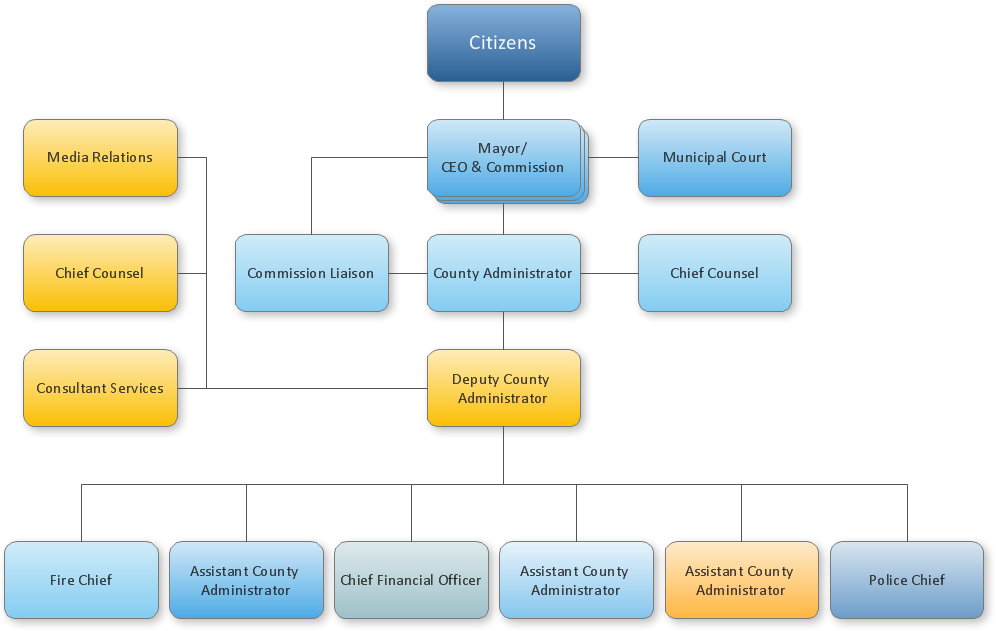
Sample 1. Organizational Chart Design in ConceptDraw DIAGRAM
Types of Organizational Charts
There are 7 main types of Organizational charts, each serving different organizational needs and reflecting varied management styles and company structures:
| Type | Description |
|---|---|
| Hierarchical Organizational Chart | Illustrates a top-down structure in the form of a pyramid, showing levels of authority, and reporting relationships within the organization from the higher-level positions at the top to less powerful or subordinate positions below. This structure ensures clarity of the company structure, positions, roles, and relationships, visually distinguishes jurisdictions, and shows who each employee reports to. |
| Flat Organizational Chart | Provides an equitable approach and has no or few levels of middle management. This structure is often applied in small businesses and speeds up decision-making and execution of projects, enhances teamwork, facilitates communication, makes interaction among employees more transparent, and empowers self-management. |
| Matrix Organizational Chart | Matrix Organizational Chart: Combines elements of the hierarchical and flat structures and is typically used in companies with employees divided into teams by projects or products. It is especially useful when one employee reports to multiple managers and is involved in several different projects. This structure creates a flexible and dynamic work environment providing great opportunities for improvement, encourages staff, and allows managers to pick individuals according to the project's needs quickly. |
| Functional Organizational Chart | Organizes employees by departments (IT, marketing, finance, etc.) or functions, and grouping together employees with similar skills, expertise, or specialization. This structure is common in large companies and highlights departmental roles and their contribution to the overall organization's success. |
| Divisional Organizational Chart | Segments an enterprise by product lines, services, or geographic locations. Each division operates sufficiently independently from others according to individual strategy. It is a common structure for large corporations helping them to stay flexible, improve personal strategy, and faster response to developments in the market or consumer needs. |
| Team-Based Organizational Chart | Organizes employees by departments and establishes teams for specific projects or goals. This structure is focused on teamwork, flexibility, and cross-functional collaboration, dynamics, and quick conflict resolution that improves efficiency and accountability, reduces the need in leadership, and enhances openness by cracking down on barriers. |
| Network Organizational Chart | Visualizes the complex network of business on-site and off-site links, relies on open communication, connections, and managing numerous units, such as off-site places, regional offices, private contractors, freelancers, suppliers, and more. It enables enterprises to be versatile and adaptive, contributes to cooperation, and improves decision-making and keeping procedures and workflows. |
Components of an Organizational Chart
An organizational chart uses a set of components to provide a clear and visual understanding of the structure and relationships within an organization. Typically, the employees or positions are represented by boxes, which can include photos and contact information in addition to the name and position title. Other shapes are also used and may vary to indicate different levels of authority or function, as well as the size or color of the objects. The lines both straight or curved and arrows are used to link the levels together and show hierarchy, responsibilities, and reporting relationships. Solid lines usually show direct reporting, while dotted lines indicate secondary relationships.
Organizational charts may also include a legend that explains special designations, symbols, or colors used in the chart and helps to give a comprehensive understanding of an organization’s structure, roles and responsibilities of employees.

Sample 2. Organizational Chart — New York State Education Department.
Key Purposes of Organizational Charts
The key purpose of any company is its long-term success in the market, usefulness for customers, development, and profit. In that direction, the optimal organizational structure and its transparent visualization are essential for business success. Org charts offer many benefits to organizations at any level, for HR, organizational leaders, management, and all other employees. The main purpose of an Organizational chart is to show a clear structure of the business, the division of responsibilities among departments and teams, and relationships between employees and functional groups.
The relationships between employees and clear communication have enormous value in the company. Most business projects require cross-functional coordination. The organizational chart is a foundation for easy communication, coordination, and cooperation in a company, human resource management, headcount planning, and more. It helps prevent unnecessary conflicts and miscommunications, makes operations smoother, and promotes growth.
Business organizational chart helps a business to improve overall workforce management and organizational dynamics, directing each employee’s contribution toward achieving company objectives, and aiding in decision-making workflows. They help to identify the chain of command, outline cross-functional relationships and streamline cross-functional collaboration, allocate resources, plan business growth, streamline internal workflows, and restructure project teams or the entire business if needed. Org charts assist in the division of functions, avoiding duplicated tasks and not completing assigned tasks or other conflicts.
The Organizational chart helps to delineate, structure, and restructure responsibilities across the organization, assess employee workloads, structure work teams, and increase employee engagement and motivation to improve their efficiency. It is also a great support for new employees to explore who their colleagues are and who they should report to. Org charts help employees to be more productive and successful, reduce the amount of time needed to obtain information, and serve as a great motivator because they clarify their promotional opportunities within an organization. On the other side, an Org chart diagram shows each manager’s span of control and helps to assess and correct their workload.
Org charts spotlight gaps in organizational structure, determine staffing needs, and are an essential tool for succession planning and career development. They facilitate change management, support risk mitigation, visualize growth, transparency, and trust, as well as are beneficial for financial resource allocation, budgeting, budget analysis, and enhancing productivity based on the reporting results.
Creating an Effective Organizational Chart
Creating an effective Organizational chart assumes the following simple steps:
- Defining the purpose of the Org chart, such as internal communication, onboarding, strategic planning, etc.
- Collecting information and data on departments and their functions, employees, roles, job titles, and reporting relationships.
- Selecting a format for your chart, such as hierarchical, matrix, flat, etc. based on the organization’s structure.
- Choosing convenient designing software to draw Organization chart. Our recommendation is the powerful diagramming and vector drawing software ConceptDraw DIAGRAM enhanced with Organizational Charts solution.
- Using pre-made shapes assists in designing your Organizational Chart in minutes. Represent positions using boxes and add names and titles. Use lines or arrows to establish reporting relationships. Keep your chart simple and organized to ensure its comprehensibility.
- Using colors helps to distinguish departments or levels. Adding symbols or pictures assists in highlighting or personalizing some components. However, try to avoid unnecessary details and overloading the chart.
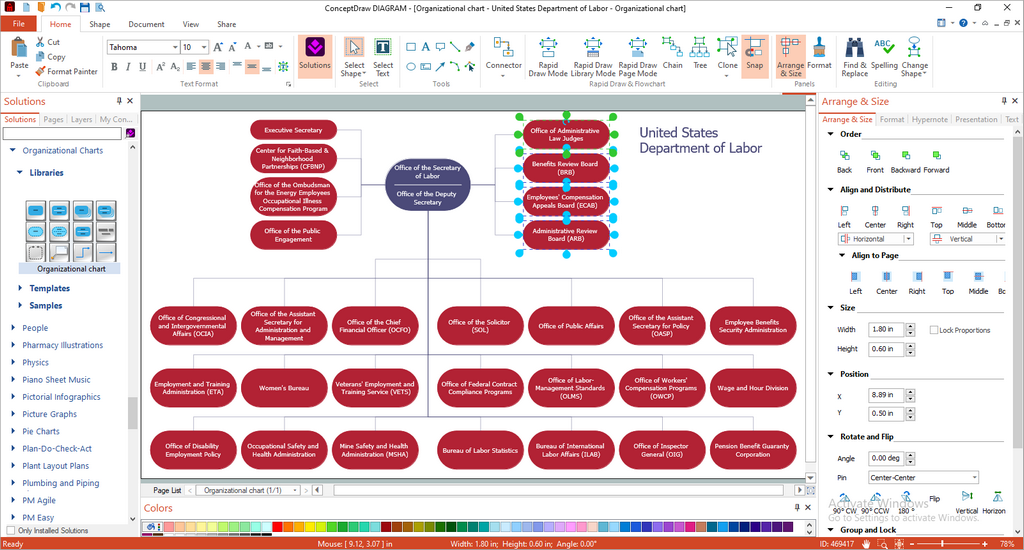
Sample 3. ConceptDraw DIAGRAM — Organizational Chart Software
Using Org Chart Software: Key Advantages
Using professional Org structure software to design an Org chart opens new perspectives and:
- simplifies the drawing process both for professionals and beginners;
- saves time;
- improves clarity;
- assists in making Org charts more precise, easily understandable, and professionally appealing;
- facilitates understanding of the organization’s hierarchy and structure for employees, their positions, roles, relationships, and reporting lines;
- helps to keep the chart up-to-date;
- simplifies communication about changes;
- facilitates making corrections with any changes in the company's work or structure;
- enhances visual communication and collaboration;
- improves integration with existing HR systems and other software;
- supports analytics, reporting, and identifying areas for improvement;
- enhances management;
- increases the company's success and growth.
Benefits of Using ConceptDraw DIAGRAM Org Chart Software
ConceptDraw DIAGRAM software extended with Organizational Charts solution provides many benefits for designing Organizational charts. The ready-made vector shapes included in the Organizational Charts solution allow you to draw Org chart with ease focusing on the structure and hierarchy, roles and relationships within a company. ConceptDraw DIAGRAM assists you in drawing an Organizational Chart of any complexity for the organization of any size and structure. It helps to make Organizational chart precise and clarify roles and relationships even in complex hierarchies. The set of Org chart examples and samples included in the Organizational charts solution and available from ConceptDraw STORE is also a way to simplify the drawing process.

Sample 4. Organizational Chart Library Design Elements
In modern realities, organizational structures and roles often change as a result of restructuring, hiring, shifting roles, or other factors. Therefore, maintaining an Org chart relevant is incredibly important. Ensure that your chart is up-to-date and reflects information and changes correctly. ConceptDraw DIAGRAM Org chart software allows making changes quickly and easily whenever it is required.
The Organizational chart designed for a large company or corporation with many departments or separate offices can be split into parts and organized as a multi-page document. When your Organizational chart is ready, ensure that it is accessible to all stakeholders. ConceptDraw DIAGRAM provides extended capabilities for sharing your diagrams, exporting in different formats, making presentations, and sending via e-mail directly from the application.

Sample 5. Organizational Charts Solution in ConceptDraw STORE
Conclusion
An Organizational chart is an incredibly valuable resource for management and strategic planning. It is useful for all employees because visualizes a complete organization, enhances clarity of the company's structure, shows relations between employees and lines of reporting, improves communication and cooperation within the organization, as well as budgeting, and overall company's success.
ConceptDraw DIAGRAM software enhanced with the Organizational charts solution is a powerful software with a user-friendly interface and powerful tools, which will help you to make an Organization chart and design it professionally looking. It also assists in managing complex systems and keeping them up-to-date. Predesigned shapes, customization options, and wide export and integration capabilities make this software the ideal Org chart maker.