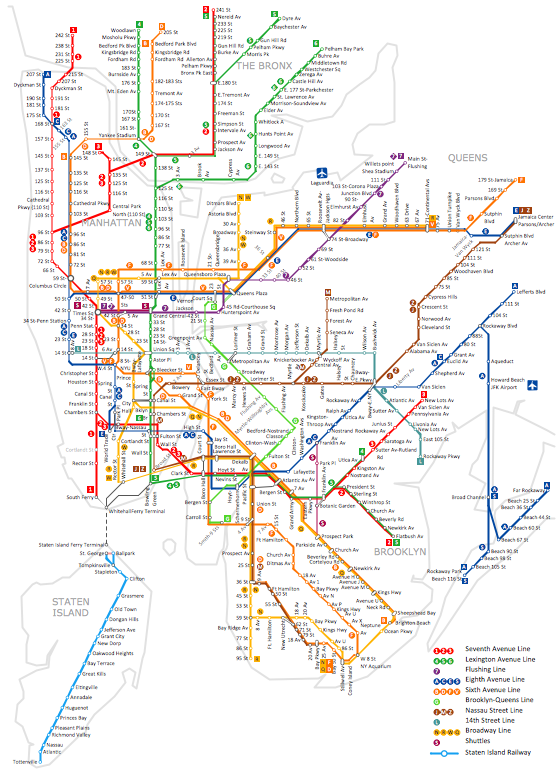
Pic.2. Metro Map Solution
The first underground line of the subway opened on October 27, 1904, almost 35 years after the opening of the first elevated line in New York City.
About this sample
- The sample you see on this page was created in ConceptDraw DIAGRAM using the Metro Map solution, and demonstrate the solutions capabilities and the results you can achieve using this solution.
- This map was created in ConceptDraw DIAGRAM using the Transport Map library from the Metro Map solution. An experienced user spent almost 8 hours creating such complex chart.
- All source documents are vector graphic documents. They are available for reviewing, modifying or converting to a variety of formats (PDF file, Power point Presentation, image or MS Visio) from the Template Gallery of ConceptDraw DIAGRAM for all users who have installed Metro Map solutions.
See also:
Video Tutorial "How to draw Metro Map style infographics?"
Tutorial explains Metro Map tools, demonstrate how to add stations to the map, control the direction in which you create new stations, change lengths, add text, Lines and Landmarks objects. This video demonstrate ConceptDraw Metro Map Solution.
TEN RELATED HOW TO's:
If you have a small budget to design a computer network, you have to be very careful. One of the most cheap technologies to implement is a bus network topology, however it has many disadvantages. For instance, if the network cable is somehow damaged, the entire network won't work.
This diagram illustrates a so-called "Bus" network topology. This type of network arrangement means that each computer or other device is linked to a main link (bus). The end nodes are shown as a circle. The links to the bus are depicted as solid vertical lines. The bus is shown as a bold horizontal line. This diagram can serve as a template for creating logical or physical network diagrams. The set of vector libraries supplied with ConceptDraw Computer and Networks solution contains the symbols of all LAN and WLAN elements required for creating network diagrams of any configuration.
Picture: Bus Network Topology
Related Solution:
ConceptDraw defines some map types, divided into three categories. Every map type has specific shapes and examples.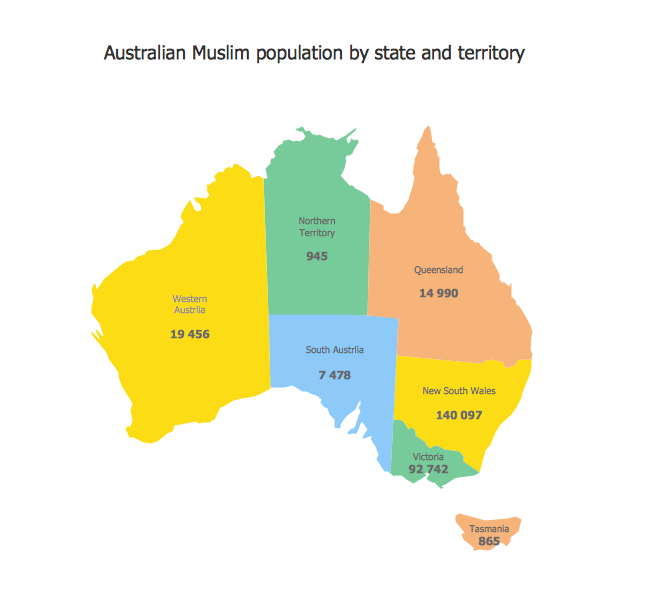
Picture: Types of Map - Overview
Related Solution:
Victoria (abbreviated as Vic.) is a state in the south-east of Australia. Victoria is Australia's most densely populated state and its second-most populous state overall.
Picture: Geo Map - Australia - Victoria
Related Solution:
Of course it is possible to keep network records in text documents, but it is very difficult to use them later. A more sound way to keep such documentation is to create a network diagram that might represent either logical network structure or physical. These diagrams are easy to understand and you will thank yourself later.
There is a physical network diagram. It is a tool to represent, maintain and analysis of network equipment and interconnections. Network diagram depicts the actual network information in the attractive clear graphic form. One can learn here the LAN cable length, telecommunication type and carrying capacity. The diagram depicts servers, IP address and domain name as well. Also it shows location of hubs, switches, modems, routers, and other network equipment. The sets of special symbols and images delivered with ConceptDraw Network Diagrams solution are used to show network components. Symbols have a standard view. Therefore, various specialists can read the network diagram without any discrepancies.
Picture: Network diagrams with ConceptDraw DIAGRAM
Related Solution:
ConceptDraw DIAGRAM is idea to draw the geological maps of World from the pre-designed vector geo map shapes.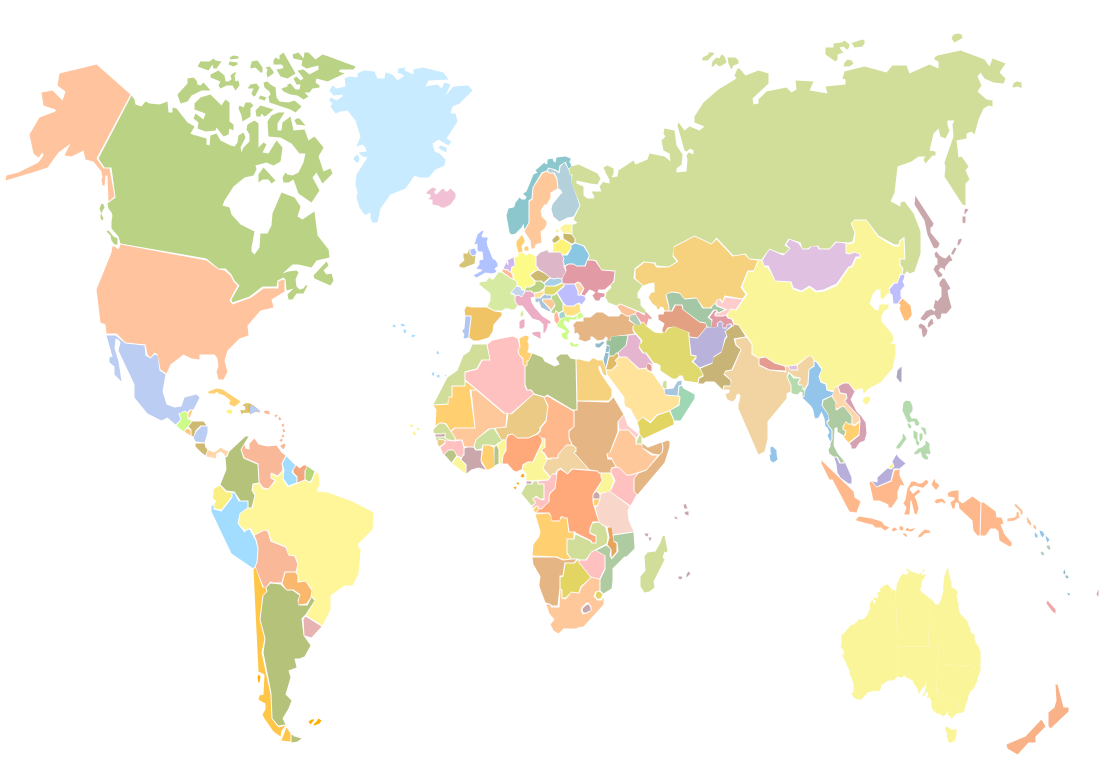
Picture: Geo Map - World
Related Solution:
An organizational chart is a diagram that shows the structure of an organization and the relationships of its parts. ConceptDraw DIAGRAM extended with Organizational Charts Solution from the Management Area is powerful Organizational Chart Software.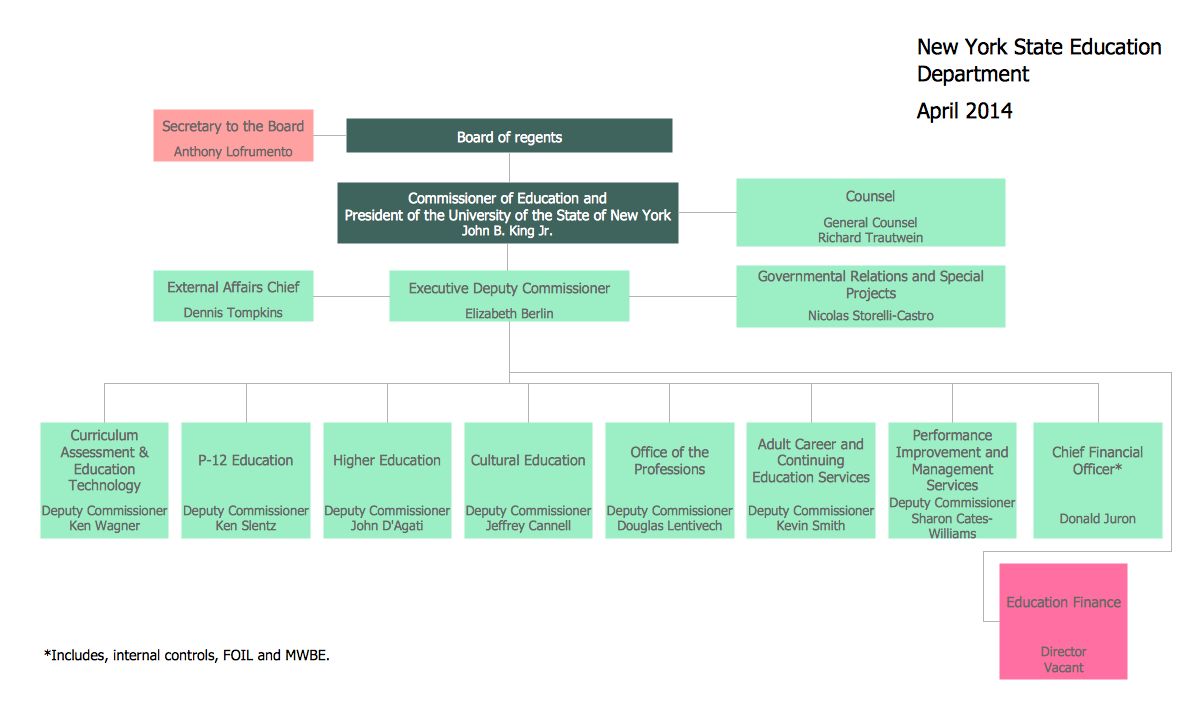
Picture: Organizational Chart
Related Solution:
ConceptDraw DIAGRAM software provides vector shapes and connector tools for quick and easy drawing diagrams for business, technology, science and education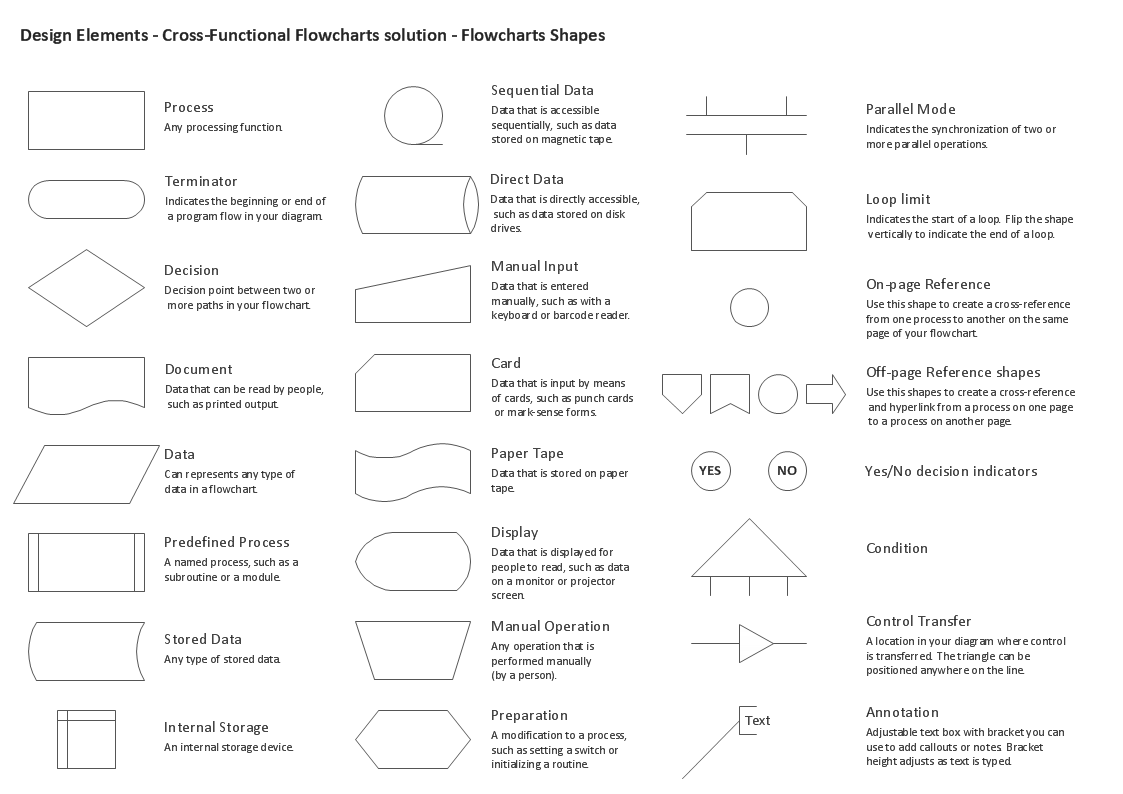
Picture: Cross Functional Flowchart Shapes Stencil
Collaboration Software helps to transform shared MINDMAP documents to build an effective team collaboration.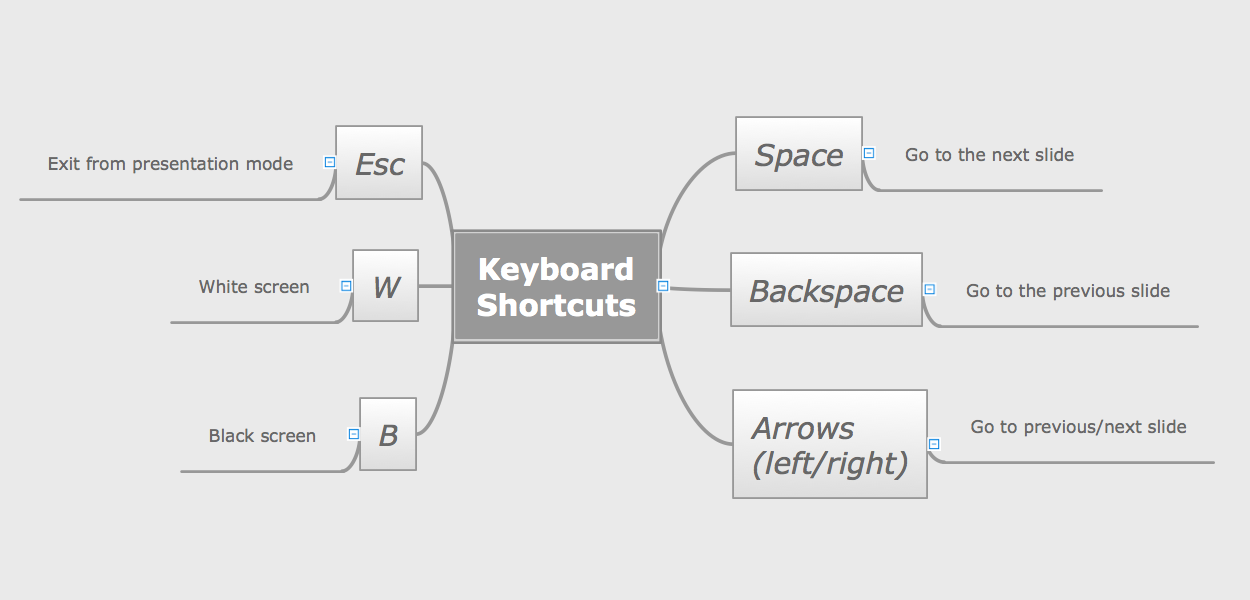
Picture: How To Use Collaboration Software
Related Solution:
This sample shows the Business Report Pie Chart. The Pie Chart visualizes the data as the proportional parts of a whole, illustrates the numerical proportion. Pie Charts are very useful in the business, statistics, analytics, mass media.
Picture: Business Report Pie. Pie Chart Examples
Related Solution:
No one can imagine a geography class without such educational stuff as a geo map or a globe. As for one of the biggest countries in North America, the United States of America Map is present in every American school or college. It’s easier to remember all the states if you look on the map more often.
The following sample represents the map of USA. This precise map has names of all states of America. The different colors which are used to indicate each state add the visuality and brightness to the whole map. The ConceptDraw USA Maps solution - one of a family of ConceptDraw Maps solutions. Any country invokes a big piece of data: geographical, political, statistical, etc. A simple way of representing this data is to design maps that will show a certain item in relation to a particular area of Earth.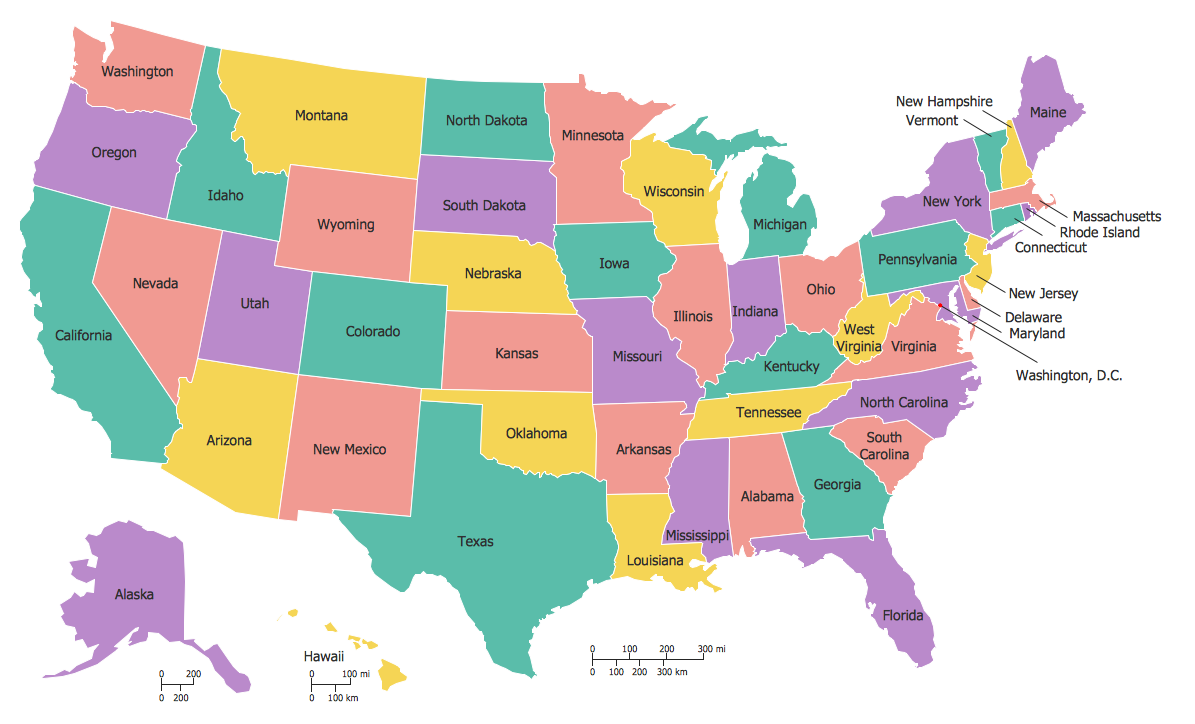
Picture: How to Draw the US Map? ConceptDraw Diagram Software for Easy USA Map Drawing
Related Solution:
