Subway infographic design elements - software tools
Use ConceptDraw DIAGRAM software extended with Metro Map solution from ConceptDraw solution park to create metro maps, route maps, bus and other transport schemes, or even tube-style infographics.
This is a one-click tool to add stations to the map. It lets you control the direction in which you create new stations, change lengths, and add text labels and icons. It contains Lines, Stations, and Landmarks objects
Many Smart Vector Objects and Tools for Subway-style Infographics |

About infographic design elements
- This is screen capture of few design elements used ConceptDraw DIAGRAM software with Metro Map solution to demonstrate major design elements and the results you can achieve using this solution.
- Includes Smart Objects with shape-switching capabilities.
- Metro Map Solution is part of ConceptDraw Solution Park extentions for ConceptDraw software products.
- All final documents are vector graphic documents and can be exported to major graphic data formats. They are samples which available for reviewing, modifying or converting to a variety of formats (PDF file, Power point Presentation, image or MS Visio) from ConceptDraw STORE, for all users who have installed Metro Map solutions.
See also:
Video Tutorial "How to draw Metro Map style infographics?"
Tutorial explains Metro Map tools, demonstrate how to add stations to the map, control the direction in which you create new stations, change lengths, add text, Lines and Landmarks objects. This video demonstrate ConceptDraw Metro Map Solution.
TEN RELATED HOW TO's:
Subway infographic design elements of MetroMap and ConceptDraw software tools.
Picture: Subway infographic design elements - software tools
Related Solution:
Professional software: visualize general system architecture, AWS diagrams are part of architecturing tools provided with ConceptDraw Solution Park.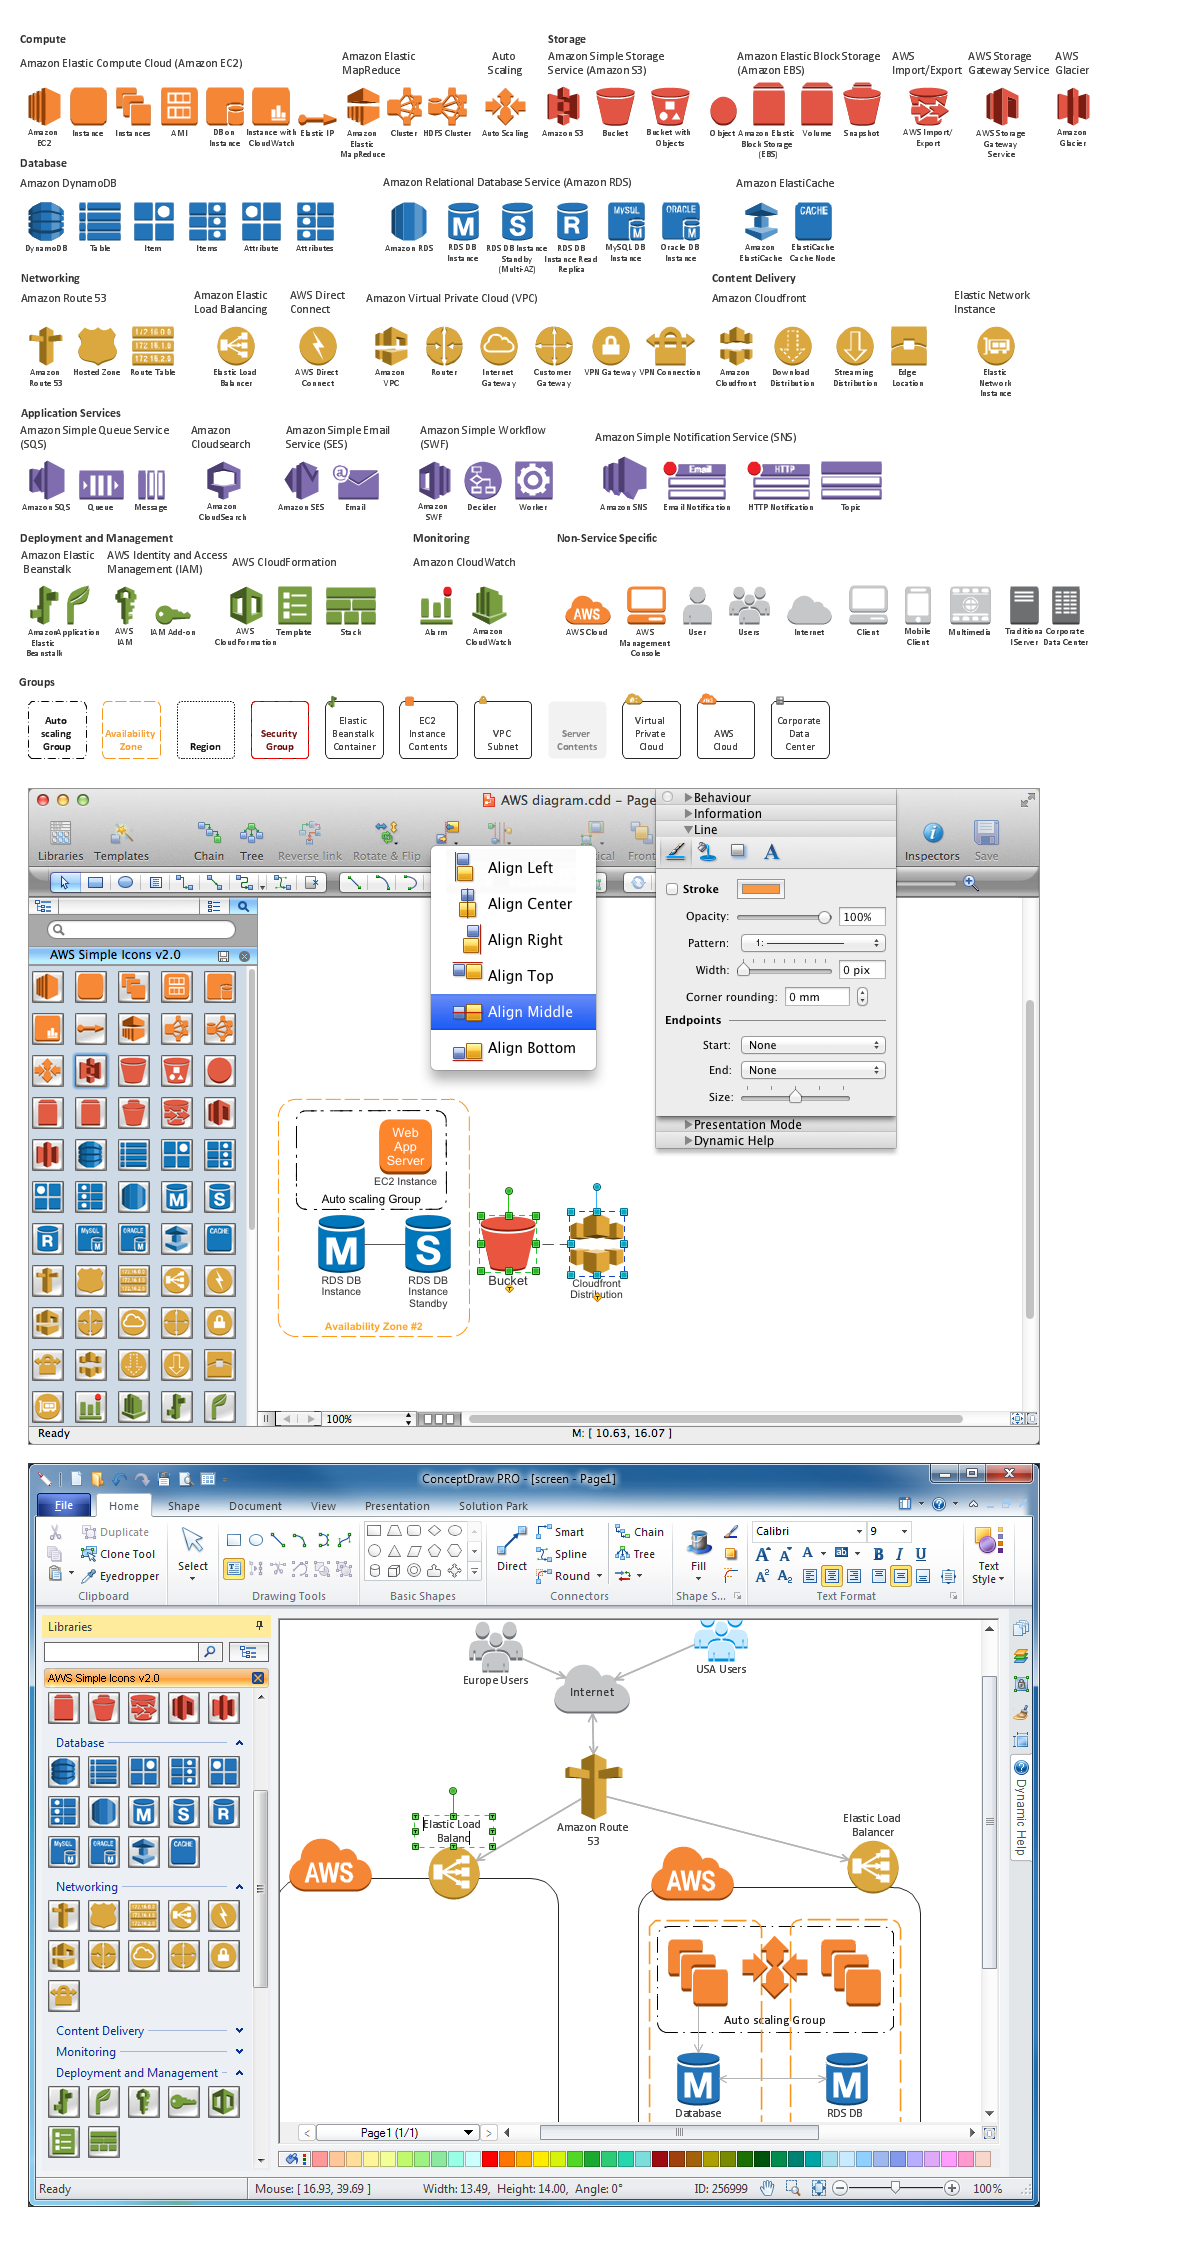
Picture: Diagramming software for Amazon Web Service diagrams, charts and schemes
Draw detailed Computer Network Diagrams, Designs, Schematics, and Network Maps with ConceptDraw DIAGRAM in no time! Pre-drawn shapes representing computers, network devices plus smart connectors help create accurate diagrams and documentation.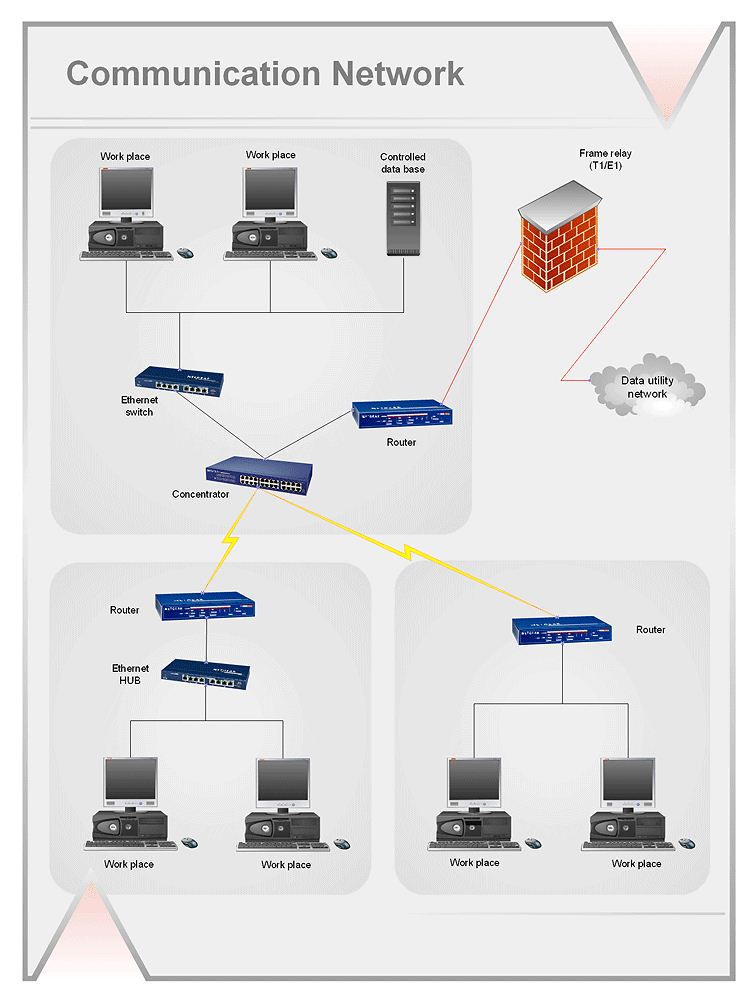
Picture: Network Diagramming with ConceptDraw DIAGRAM
When trying to figure out the nature of the problems occurring within a project, there are many ways to develop such understanding. One of the most common ways to document processes for further improvement is to draw a process flowchart, which depicts the activities of the process arranged in sequential order — this is business process management. ConceptDraw DIAGRAM is business process mapping software with impressive range of productivity features for business process management and classic project management. This business process management software is helpful for many purposes from different payment processes, or manufacturing processes to chemical processes. Business process mapping flowcharts helps clarify the actual workflow of different people engaged in the same process. This samples were made with ConceptDraw DIAGRAM — business process mapping software for flowcharting and used as classic visio alternative because its briefly named "visio for mac" and for windows, this sort of software named the business process management tools.
This flowchart diagram shows a process flow of project management. The diagram that is presented here depicts the project life cycle that is basic for the most of project management methods. Breaking a project into phases allows to track it in the proper manner. Through separation on phases, the total workflow of a project is divided into some foreseeable components, thus making it easier to follow the project status. A project life cycle commonly includes: initiation, definition, design, development and implementation phases. Distinguished method to show parallel and interdependent processes, as well as project life cycle relationships. A flowchart diagram is often used as visual guide to project. For instance, it used by marketing project management software for visualizing stages of marketing activities or as project management workflow tools. Created with ConceptDraw DIAGRAM — business process mapping software which is flowcharting visio alternative or shortly its visio for mac, this sort of software platform often named the business process management tools.
Picture: Process Flowchart: A Step-by-Step Comprehensive Guide
Related Solution:
ConceptDraw DIAGRAM is a software for making infographics illustrations. You can work with various components to build really impressive and easy-to-understand infographics design.
Picture: Spatial infographics Design Elements: Continental Map
Follow samples and map templates to create nfographic maps. It's super-easy!
Picture: Map Infographic Creator
Electrical plan is a document that is developed during the first stage of the building design. This scheme is composed of conventional images or symbols of components that operate by means of electric energy. To simplify the creation of these schemes you can use house electrical plan software, which will not require a long additional training to understand how to use it. You only need to install the necessary software ant it’s libraries and you’ll have one less problem during the building projection.
Any building contains a number of electrical systems, including switches, fixtures, outlets and other lightening equipment. All these should be depicted in a building electrical plans and included to general building documentation. This home electrical plan displays electrical and telecommunication devices placed to a home floor plan. On the plan, each electrical device is referenced with the proper symbol. Electrical symbols are used for universal recognition of the building plan by different persons who will be working on the construction. Not all possible electric symbols used on a certain plan, so the symbols used in the current home plan are included to a legend. The electrical home plan may be added as a separate document to a complete set of building plans.
Picture: How To use House Electrical Plan Software
Related Solution:
Create value stream maps - for value stream analysis and value stream management, material and information flow mapping, using our quick start templates included with ConceptDraw.
Picture: Best Value Stream Mapping mac Software
Related Solution:
Subway infographic design elements for ConceptDraw DIAGRAM (mac and pc).
Picture: Infographic design elements, software toolsSubway and Metro style
Related Solution:
Infographic Design Elements for visually present various geographically distributed information.
Picture: Spatial infographics Design Elements: Location Map
ConceptDraw
DIAGRAM 18