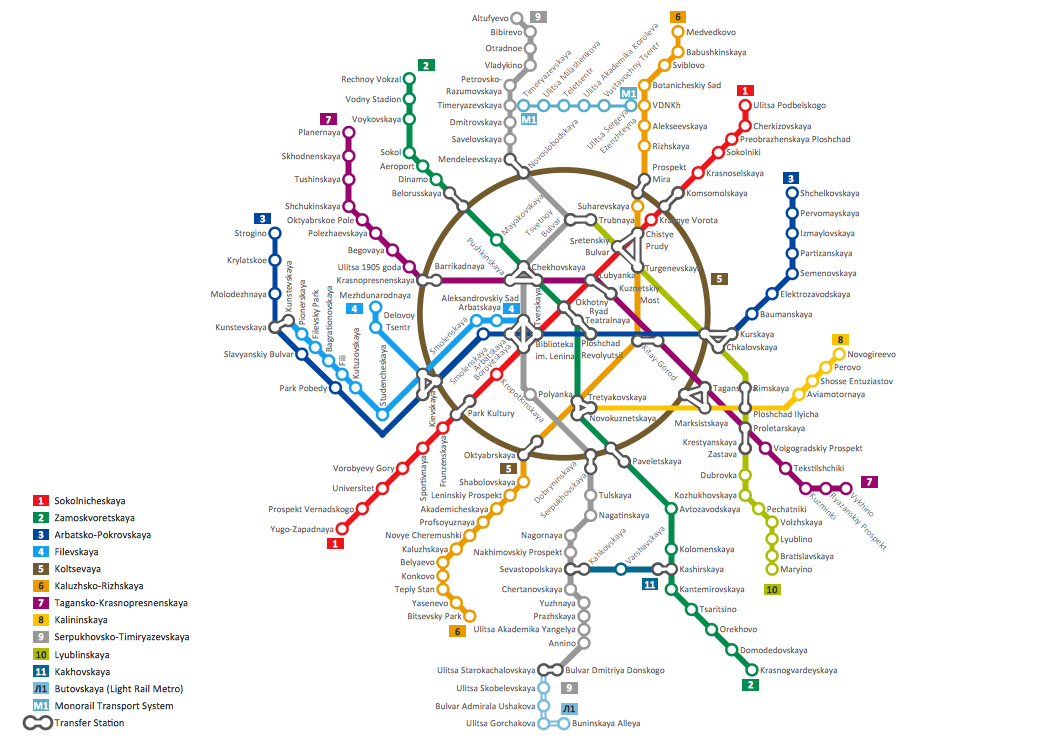
Example 1. Maps Driving Directions
Drawing of Maps Driving Directions requires a lot of time and efforts. Directional Maps Solution with its extensive drawing tools, 10 libraries with 338 predesigned vector objects are the real help in self-dependent drawing process.

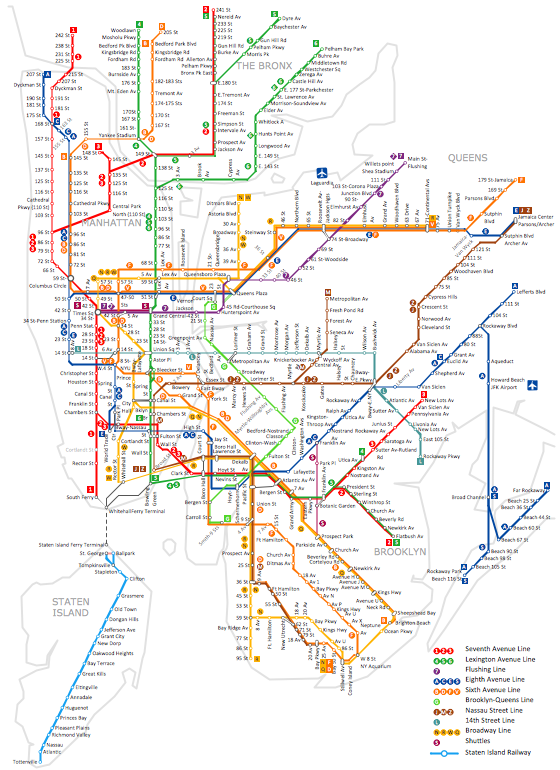
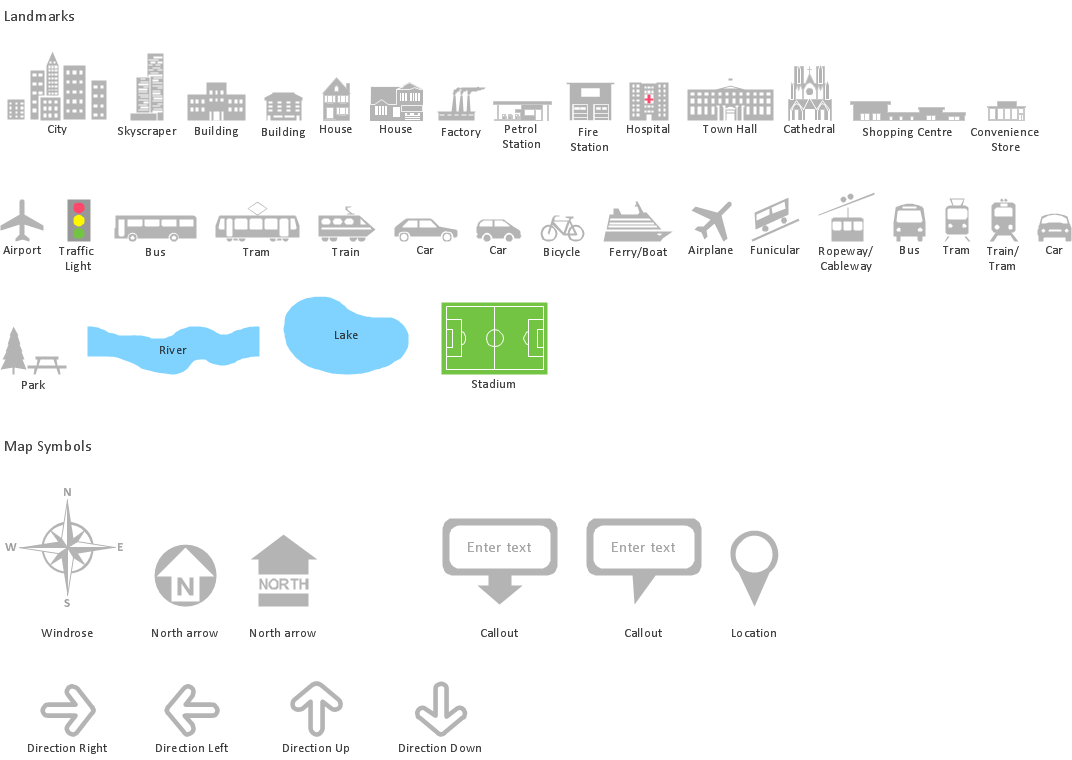
Example 2. Subway Map Chart Library Design Elements
Simply drag the desired vector shapes from the libraries of Directional Maps Solution, arrange them, add text and additional clipart from other libraries of ConceptDraw Solution Park if needed, make some style changes, and your professional looking Directional Map will be ready.

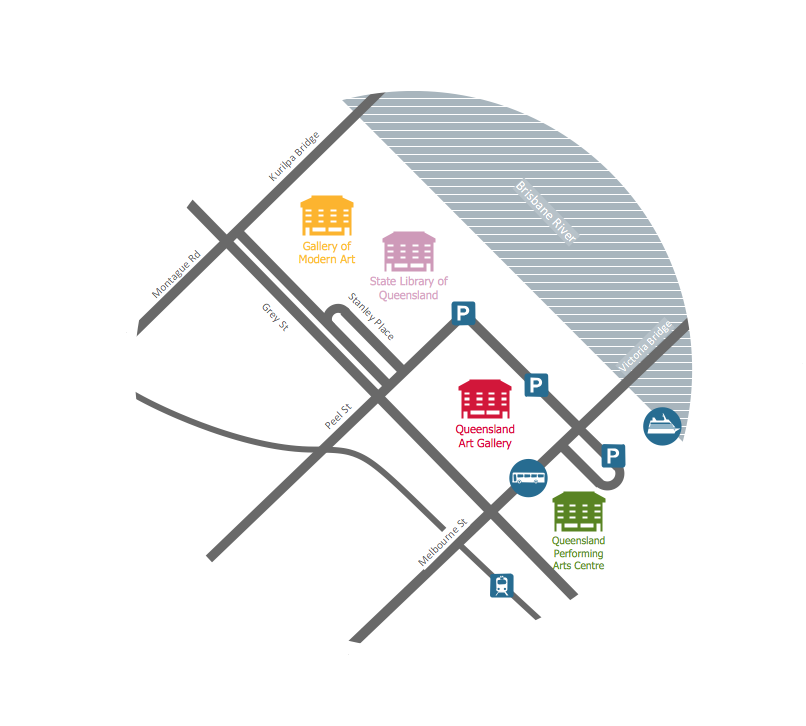
Example 3. Rolla USGS Center Locator Map
The samples you see on this page were created in ConceptDraw DIAGRAM software using the tools of Directional Maps Solution. An experienced user spent 10 minutes creating every of these samples.
Use the Directional Maps Solution for ConceptDraw DIAGRAM Solution Park to create fast and easy your own maps driving directions via the town, between the cities, and many other directional maps.
All source documents are vector graphic documents. They are available for reviewing, modifying, or converting to a variety of formats (PDF file, MS PowerPoint, MS Visio, and many other graphic formats) from the ConceptDraw STORE. The Directional Maps Solution is available for all ConceptDraw DIAGRAM or later users.
FIVE RELATED HOW TO's:
Working with information can be quite tedious, furthermore, some data can be quite difficult to perceive without any graphic representation. So, to facilitate your work, you can use business diagrams, such as simple flowcharts or Gantt charts for project management and orgcharts for clarifying your company structure. You can use a proper software, like ConceptDraw Pro, draw them on paper, or use whiteboards, but it is more convenient to use a digital tool.
This diagram shows a cross-functional flowchart that was made fore telecom service provider. A workflow of a common telecommunication service provider has a rather branched structure. Thus, it is useful to have a flow chart to visualize the sequences and interrelations of the work flow steps. Business process flowchart contains 17 processes and 4 decision points,that are distributed through 2 lines depicting the participants involved. Also there are connectors that show the data flow within processes. This flowchart displays a detailed model of the telecom service trading process, as well as all participants in the process and how they interact with each other.
Picture: Business diagrams & Org Charts with ConceptDraw DIAGRAM
The Total Quality Management Diagram solution helps your organization visualize business and industrial processes. Create Total Quality Management diagrams for business process with ConceptDraw software.
Picture: Management Tools — Total Quality Management
Related Solution:
ConceptDraw DIAGRAM software extended with Directional Maps Solution from the Maps Area of ConceptDraw Solution Park offers you the set of useful tools for easy drawing map directions, directional maps, road maps, navigation schemes, transit maps of any complexity, etc.
Picture: Map Directions
Related Solution:
Draw your own business process flowcharts using ConceptDraw DIAGRAM diagramming and business graphics software.
The Flowcharts Solution for ConceptDraw DIAGRAM is a comprehensive set of examples and samples in several different color themes for professionals that need to graphically represent a process.
Picture: Flow Chart Diagram Examples
Related Solution:
A database is a data collection, structured into some conceptual model. Two most common approaches of developing data models are UML diagrams and ER-model diagrams. There are several notations of entity-relationship diagram symbols and their meaning is slightly different. Crow’s Foot notation is quite descriptive and easy to understand, meanwhile, the Chen notation is great for conceptual modeling.
An entity relationship diagrams look very simple to a flowcharts. The main difference is the symbols provided by specific ERD notations. There are several models applied in entity-relationship diagrams: conceptual, logical and physical. Creating an entity relationship diagram requires using a specific notation. There are five main components of common ERD notations: Entities, Actions, Attributes, Cardinality and Connections. The two of notations most widely used for creating ERD are Chen notation and Crow foot notation. By the way, the Crow foot notation originates from the Chen notation - it is an adapted version of the Chen notation.
Picture: ERD Symbols and Meanings
Related Solution: