
Example 1. Scatter Graph - Cars price depending on age
Scatter Diagrams Solution provides wide variety of tools that will be useful for you. Collection of predesigned templates and samples included in Scatter Diagrams Solution is one of them. Use ConceptDraw STORE to choose the appropriate Scatter Graph example, click it to open in ConceptDraw DIAGRAM and to change according to you data.
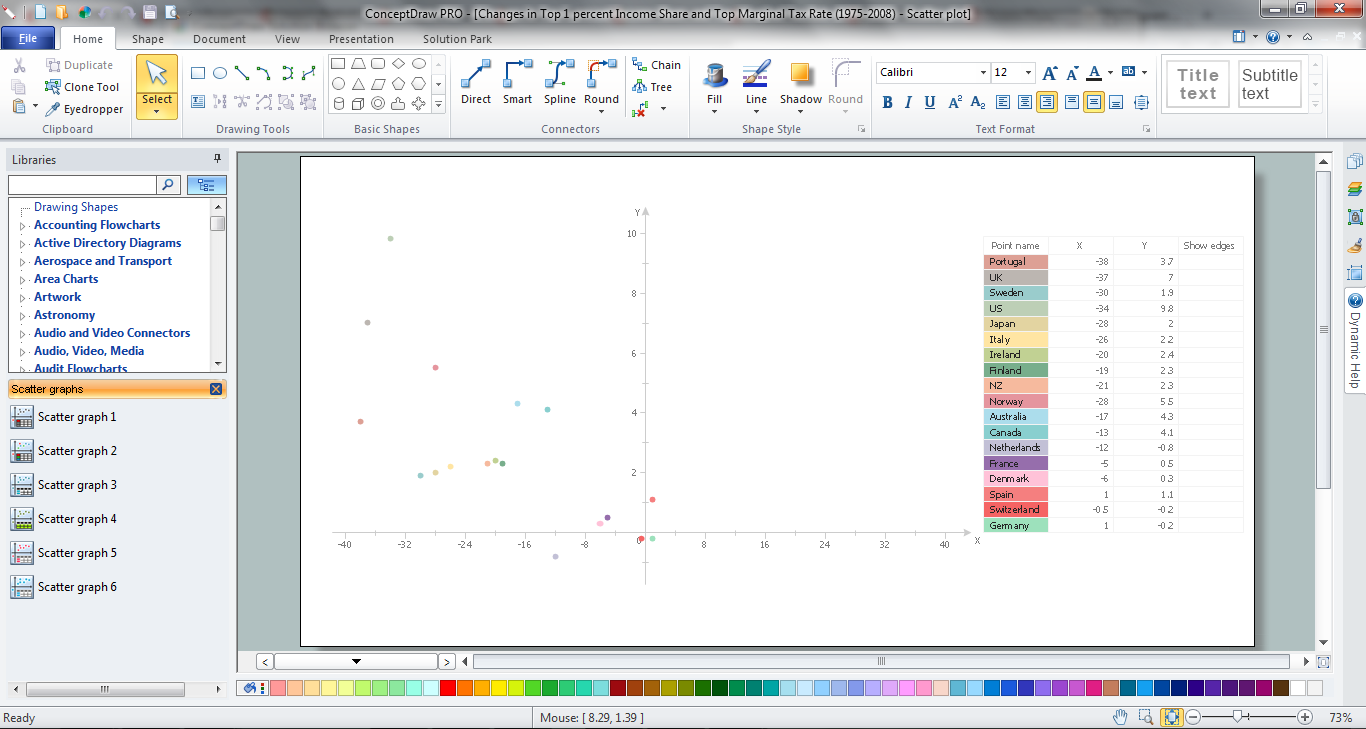
Example 2. Scatter Graph in ConceptDraw DIAGRAM /p>
Scatter Diagrams solution provides also Scatter Graphs library with variety of predesigned vector objects. Drag one of them - it will be the base for your own Scatter Graph, and when set your data in the table. The graph will be constructed automatically according to the data from the table.

Example 3. Scatter Graph - K-metoid
The examples you see on this page were created in ConceptDraw DIAGRAM using the Scatter Diagrams Solution for ConceptDraw DIAGRAM An experienced user spent 5-10 minutes creating every of these samples.
Use the Scatter Diagrams Solution from the Graphs and Charts area to draw your own Scatter Graph of any complexity quick, easy and effective.
All source documents are vector graphic documents. They are available for reviewing, modifying, or converting to a variety of formats (PDF file, MS PowerPoint, MS Visio, and many other graphic formats) from the ConceptDraw STORE. The Scatter Diagrams Solution is available for all ConceptDraw DIAGRAM or later users.
TEN RELATED HOW TO's:
ConceptDraw DIAGRAM charting and vector drawing software offers the Circle Spoke Diagram Template included to the Business Diagrams Solution from the Management Area. The use of ready template is the easiest way of drawing professional-looking Circle-Spoke Diagrams.
Picture: Circle Spoke Diagram Template
Related Solution:
The EPC diagram shows various business processes in terms of work flows.
Event-Driven Process chain Diagrams for improvement throughout an organisation.
ConceptDraw DIAGRAM - software that reduces the time needed to create a business process model and is great business process improvement tools.
Picture: The Best Tool for Business Process Modeling
Related Solution:
ConceptDraw gives the ability to draw simple diagrams like flowcharts, block diagrams, bar charts, histograms, pie charts, divided bar diagrams, line graphs, area charts, scatter plots, circular arrows diagrams, Venn diagrams, bubble diagrams, concept maps, and others.
Picture: Simple Drawing Applications for Mac
Related Solution:
ConceptDraw DIAGRAM software extended with Picture Graphs solution is the best choice for making professional looking pictures of graphs and colorful picture graphs.
Picture: Pictures of Graphs
Related Solution:
This sample shows the Scatter Plot without missing categories. It’s very important to no miss the data, because this can have the grave negative consequences. The data on the Scatter Chart are represented as points with two values of variables in the Cartesian coordinates. This sample can be used in the engineering, business, statistics, analytics, at the creating the financial and other types of reports.
Picture: Blank Scatter Plot
Related Solution:
Mathematical Drawing Software - Draw mathematical illustration diagrams easily from examples and templates!
Picture: Basic Diagramming
Related Solution:
Any hierarchical structure of any company can be represented as a triangle or a pyramid. You can create a pyramid diagram and pyramid chart of any complexity using special libraries included in ConceptDraw DIAGRAM. Actually, any knowledge or chain of facts can also be depicted as a pyramid.
A wide range of graph and chart are utilized in marketing to maintain documentation and various visual issues, that deal with marketing information and data. The marketing value pyramid can be created to illustrate how the value of company, or product is based on its competitiveness. To design this diagram we used ConceptDraw DIAGRAM drawing tools in conjunction with Pyramid solution for Solution Park.
Picture: Pyramid Diagram and Pyramid Chart
Related Solutions:
Every engineering project starts from a terms of reference document. The next stage of developing is a technical drawing, which requires using appropriate software. However, revisions and discussions about requirements are possible at any stage of development.
This technical drawing demonstrates a schematic flow diagram of pulp reclaiming. This diagram of magnetite pulp reclaiming is created using ConceptDraw Chemical and Process engineering solution, The solution delivers more than 460 vector graphic icons and connectors. Generally, it is intended for designing process and instrumentation diagrams (P&ID) for chemical and process engineering. block flow diagrams (BFD), process flow diagrams (PFD) for chemical industry.
Picture: Technical Drawing Software
Related Solution:
Value stream maps (VSM) are an essential tool for organizations applying Lean methods.
Picture: What is Value Stream Mapping?
Related Solution:
This sample shows the Spider Chart that represents the budget and spending for one organization and allows to compare them. The multivariate data are represented on the Spider Chart as a two-dimensional chart with four or more variables displayed on the axes that start in one point. The Spider Charts are used in the management, business and sport.
Picture: Spider Chart Template

