Scatter Plot Graph
ConceptDraw DIAGRAM extended with Scatter Diagrams solution is the best diagramming and vector drawing software for quick and easy designing the Scatter Plot Graph of any complexity.
Scatter Diagrams solution is a part of Graphs and Charts Area which includes also a variety other solutions for simple and fast drawing professional looking Bar Charts, Line Graphs, Pie Charts, Area Charts, Picture Graphs, Histograms, etc.
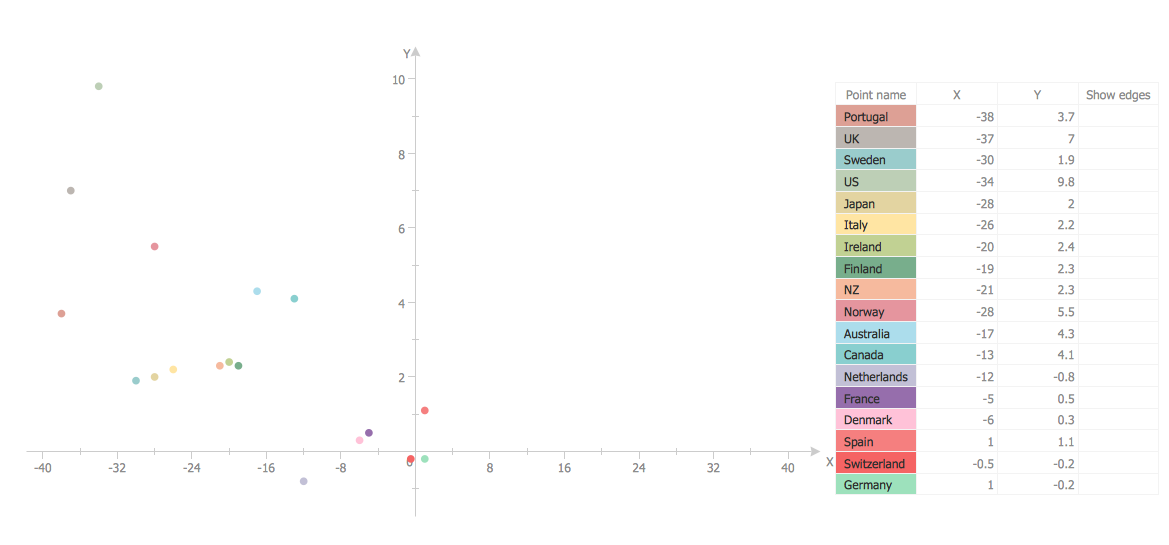
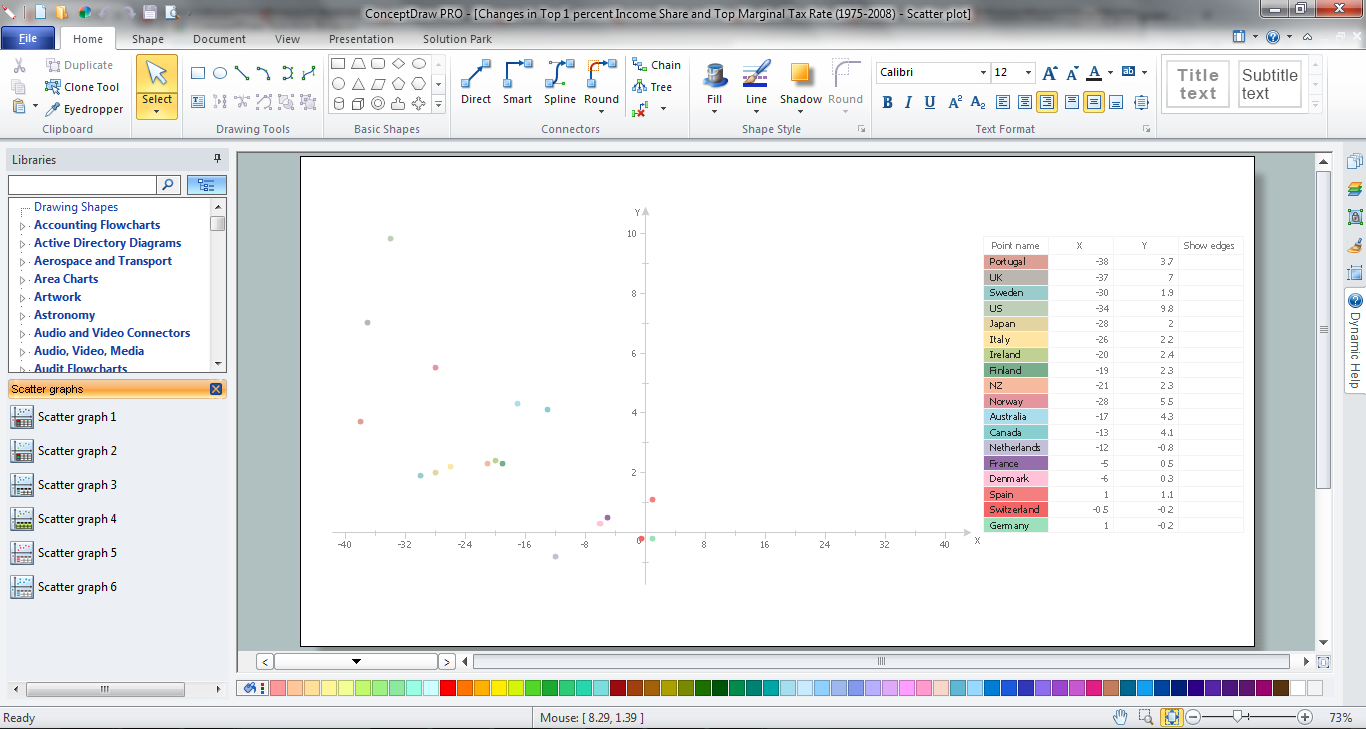
Example 1. Scatter Plot Graph - Changes in Top Income Share and Top Marginal Tax Rate
This example was created in ConceptDraw DIAGRAM using the tools of Scatter Diagrams solution. It shows a Scatter Plot Graph which illustrates the changes in top income share and marginal tax rate. An experienced user spent 20 minutes creating this example. Applying of this professional looking, visual and clear Scatter Plot Graph example will have a great success.
Use Scatter Diagrams solution for designing your own Scatter Plot Graph quick, easy and effective.
All source documents are vector graphic documents. They are available for reviewing, modifying, or converting to a variety of formats (PDF file, MS PowerPoint, MS Visio, and many other graphic formats) from the ConceptDraw STORE. The Scatter Diagrams Solution is available for all ConceptDraw DIAGRAM or later users.
See also Samples: