Scatter Chart Analysis. Scatter Chart Example
This sample was created in ConceptDraw DIAGRAM diagramming and vector drawing software using the Line Graphs Solution from Graphs and Charts area of ConceptDraw Solution Park.
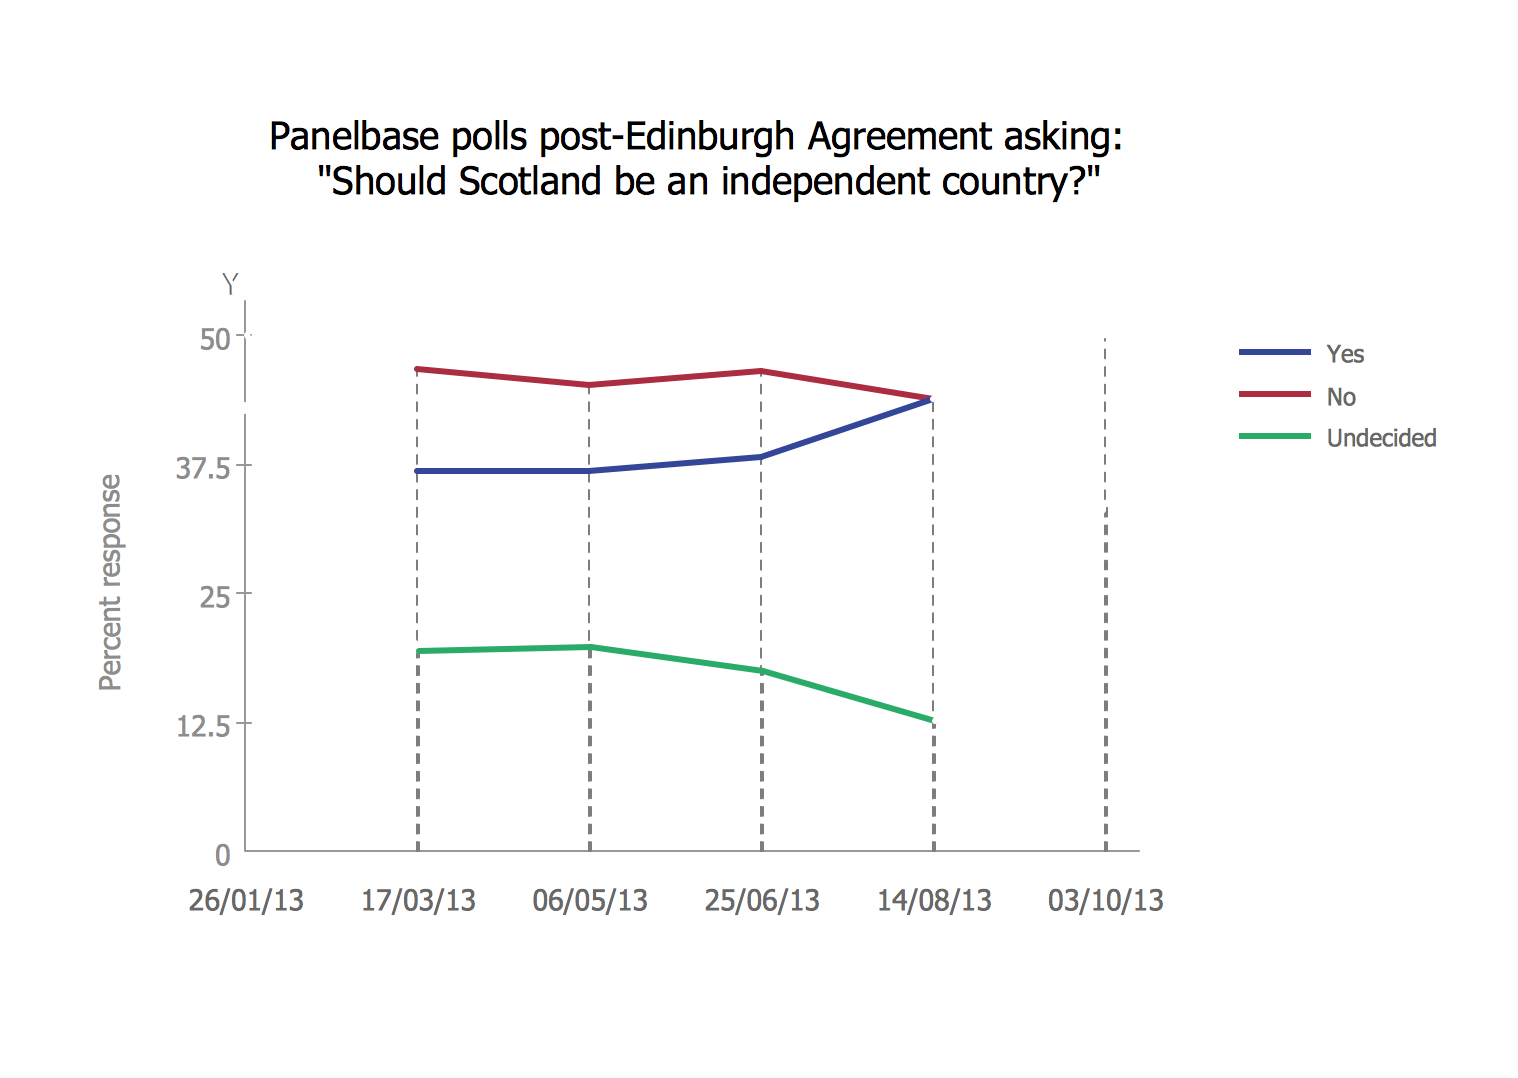
This sample shows the Scatter Chart that displays the polls on the referendum 2014 in Scotland. On this Scatter Chart the data are represented as points with two values of variables in the Cartesian coordinates. The points are connected by lines. This diagram can be useful in different opinion polls, referendums, for creating the reports.

Example 1. Scatter Chart Analysis
Using the ready-to-use objects from the Line Graphs Solution for ConceptDraw DIAGRAM you can create your own professional looking Scatter Charts quick and easy.
The Scatter Charts produced with ConceptDraw DIAGRAM are vector graphic documents and are available for reviewing, modifying, and converting to a variety of formats (image, HTML, PDF file, MS PowerPoint Presentation, Adobe Flash or MS Visio).
Free Download Scatter Chart Software and View All Examples
See also Samples:
- Business Charts — Pie and Donut
- Business Charts — Bar and Histogram
- Business Charts — Area, Line and Scatter
- Marketing — Charts & Diagrams
- Flowcharts
- Orgcharts
- Quality and Manufacturing Charts
- Business Process Diagrams — Flow Charts
- Marketing — Flowcharts & Process Diagrams
- Business Diagrams — Concept Maps
- Business processes — Flow charts
- Marketing — Flowcharts and Process Diagrams
- Finance and Accounting
- Marketing — Social Media
- Business Diagrams
- Business Charts — Bar and Histogram
FOUR RELATED HOW TO's:
Rainfall Bar Chart →
This sample shows the Horizontal Bar Chart of the average monthly rainfalls. This sample was created in ConceptDraw DIAGRAM diagramming and vector drawing software using the Bar Graphs Solution from the Graphs and Charts area of ConceptDraw Solution Park.
Make a Scatter Plot →
ConceptDraw DIAGRAM diagramming and vector drawing software offers the Scatter Diagrams Solution from the Graphs and Charts Area to make a Scatter Plot creating fast and simple.
Pyramid Diagram and Pyramid Chart →
Any hierarchical structure of any company can be represented as a triangle or a pyramid. You can create a pyramid diagram and pyramid chart of any complexity using special libraries included in ConceptDraw DIAGRAM. Actually, any knowledge or chain of facts can also be depicted as a pyramid. A wide range of graph and chart are utilized in marketing to maintain documentation and various visual issues, that deal with marketing information and data. The marketing value pyramid can be created to illustrate how the value of company, or product is based on its competitiveness. To design this diagram we used ConceptDraw DIAGRAM drawing tools in conjunction with Pyramid solution for Solution Park.
Flowchart Marketing Process. Flowchart Examples →
This sample shows the Flowchart that displays the layout and work flow of the cloud marketing platform. This diagram has a style of the marketing brochure. This style displays the central product that is related to the other issues. Using the ready-to-use predesigned objects, samples and templates from the Flowcharts Solution for ConceptDraw DIAGRAM you can create your own professional looking Flowchart Diagrams quick and easy.