Scatter Graph Charting Software
Scatter plots drawing using ConceptDraw DIAGRAM
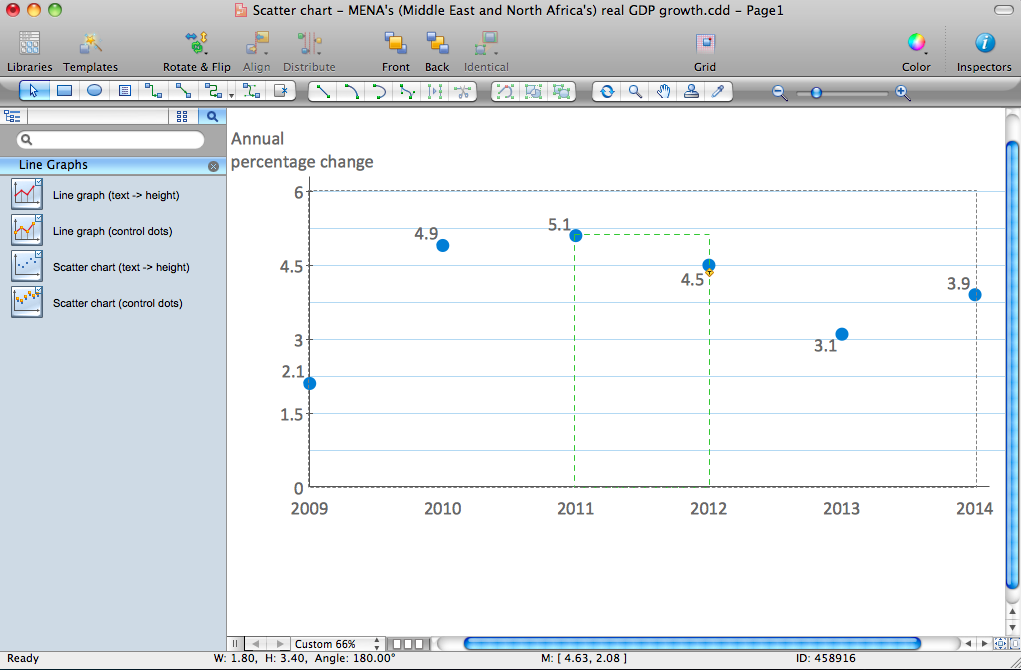
To design scatter charts use ConceptDraw DIAGRAM diagramming and vector drawing software extended with Line Graphs solution from Graphs and Charts area of ConceptDraw DIAGRAM Solution Park.
The Line Graphs solution provides templates, samples and a library of vector stencils for quick and easy drawing scatter graphs.
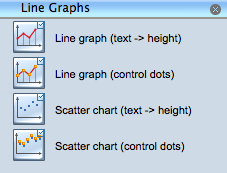
Scatter chart object library
Free Download Scatter Graph Software and View All Examples

Example 1. Scatter chart example - German tax rate on corporate income 1995-2009
See also Samples:
-
Business Charts — Area, Line and Scatter
- Marketing — Pyramids
- Business Charts — Column and Histogram
- Business Charts — Pie and Donut
- Marketing — Charts & Diagrams
- Flowcharts
- Orgcharts
- Quality and Manufacturing Charts
- Business Process Diagrams — Flow Charts
- Marketing — Flowcharts & Process Diagrams
- Business Diagrams — Concept Maps
- Business processes — Flow charts
- Marketing — Flowcharts and Process Diagrams
- Finance and Accounting
- Marketing — Social Media
- Business Diagrams
- Marketing — Pyramids
TEN RELATED HOW TO's:
ConceptDraw DIAGRAM application is perfect for creating workflow diagrams. This application contains specific features and technologies designed to draw diagrams faster, such as RapidDraw and Arrows10. ConceptDraw DIAGRAM software extended with the Workflow Diagrams solution gives you a flexible tool to draw any kind of workflow.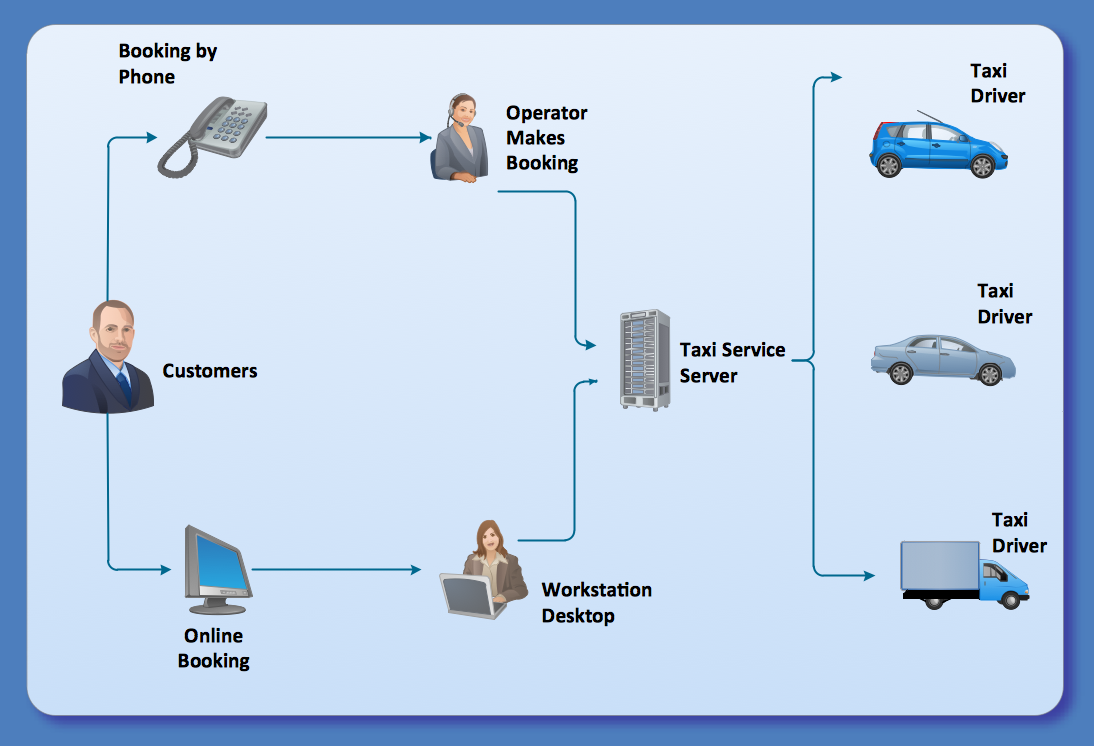
Picture: Workflow Application
Related Solution:
Use ConceptDraw DIAGRAM software as a powerful audit application. 🔸 Create professional Audit Workflow Diagrams and Audit Process Flowcharts to ✔️ plan and implement audit process, ✔️ enhance financial transparency, ✔️ improve financial reporting, ✔️ streamline operations, ✔️ improve business efficiency, ✔️ identify risks and issues, ✔️ prevent financial fraud, ✔️ track progress, ✔️ enhance trust
Picture: Understanding the Audit Process: A Comprehensive Guide. Audit Process Flowchart
Related Solution:
The Microsoft Windows Azure platform is a highly flexible cloud-based solution with variety of services which supports not only the execution of.NET applications, but also allows developers to use programming languages like Java, PHP, Node.js, or Python.
ConceptDraw DIAGRAM diagramming and vector drawing software provides the Azure Architecture Solution from the Computer and Networks area of ConceptDraw Solution Park with a lot of useful tools which make easier: illustration of Windows Azure possibilities and features, describing Windows Azure Architecture, drawing Azure Architecture Diagrams, depicting Azure Cloud System Architecture, describing Azure management, Azure storage, documenting Azure services.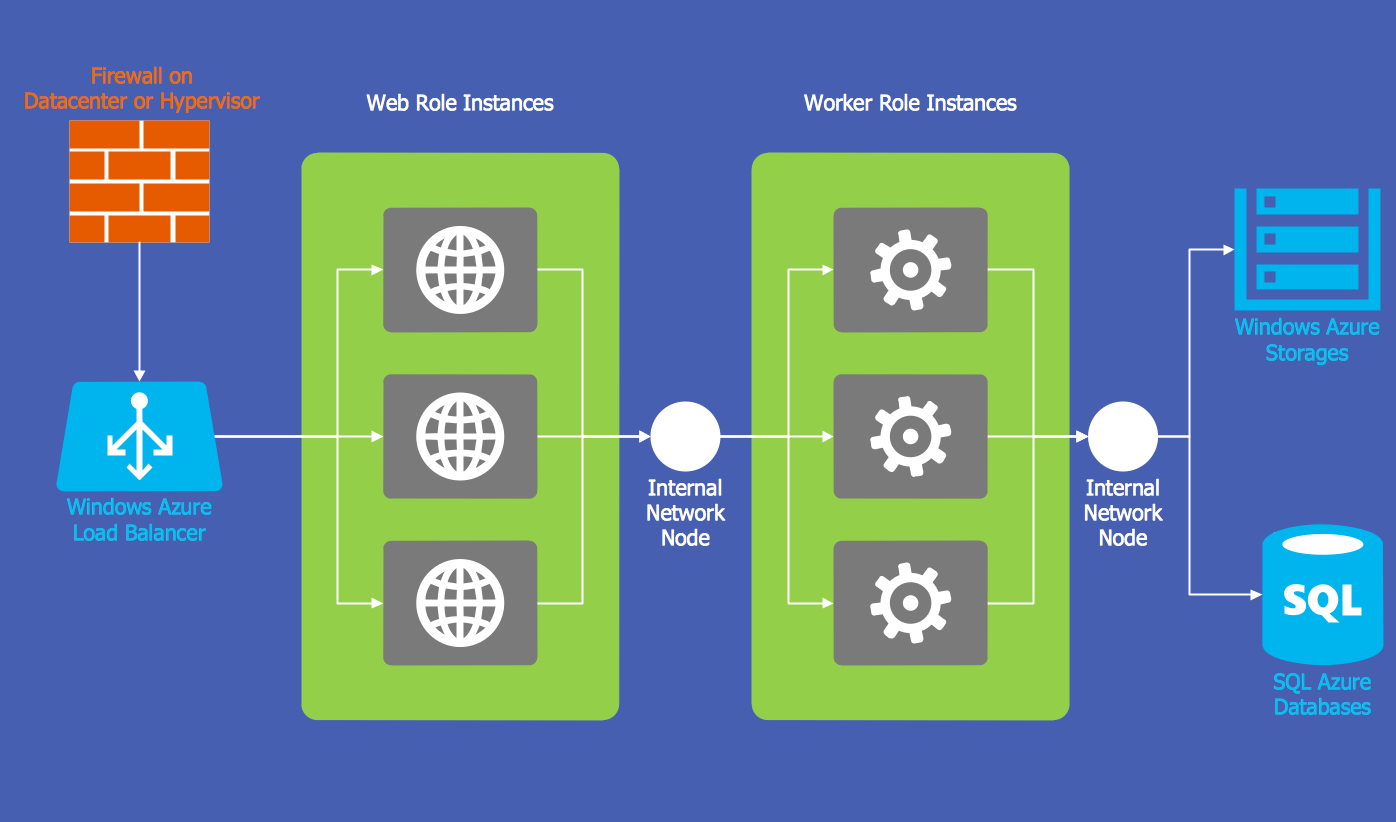
Picture: Windows Azure
Related Solution:
Use Case Diagrams technology. Using visual graphical objects IDEF1 standard allows to model information interrelations.
Picture: IDEF1 standard
Illinois is a state in the Midwestern United States. It is the 5th most populous and 25th most extensive state, and is often noted as a microcosm of the entire country.
The vector stencils library Illinois contains contours for ConceptDraw DIAGRAM diagramming and vector drawing software. This library is contained in the Continent Maps solution from Maps area of ConceptDraw Solution Park.
Picture: Geo Map — USA — Illinois
Related Solution:
Looking for the line graph examples you can simply go to the Line Graphs solution of ConceptDraw STORE to get those which were previously created especially for the ConceptDraw DIAGRAM users in order to simplify their work of making such charts.
Picture: Line Graph
Related Solution:
ConceptDraw provides some interactive xy chart and scatter graph symbols that offers advanced features yet is simple to use.
Picture: Scatter Graph Charting Software
Related Solution:
ConceptDraw DIAGRAM is workflow diagram software enhanced by numerous extentions from ConceptDraw Solution Park. It inludes many professional workflow diagrams, examples and ready to use workflow diagram and workflow symbols. Workflow symbol collections include symbols for Processes, Planning, Scheduling, Flow Control, In-Transit Process Visibility.
The best workflow diagram software you may find is ConceptDraw DIAGRAM. ConceptDraw DIAGRAM is world-known diagramming software that works for both Windows and Mac OS X platforms. The software contains complete set of features allows to draw diagrams faster. ConceptDraw DIAGRAM extended with the Workflow Diagram solution provides additional libraries, templates and samples for drawing professional workflow diagrams.
Picture: Workflow Diagram Software
Related Solution:
The use of the special software with Plant Design Solutions is a real help for effective creating the Plant Plan, Plant Layout Plan, Process Plant Layout, Plant Design. ConceptDraw DIAGRAM is the best diagramming and vector drawing software. It offers the Plant Layout Plans Solution from the Building Plans Area for achievement this goal.
Picture: Plant Design Solutions
Related Solution:
ConceptDraw DIAGRAM is a Mac OS X and Windows platforms professional software to draw your own business process diagrams and flowcharts.
Picture: Professional Diagram and Flowchart Software
ConceptDraw
DIAGRAM 18