Made with
ConceptDraw
DIAGRAM 18

Organizational Charts with ConceptDraw DIAGRAM

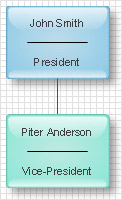
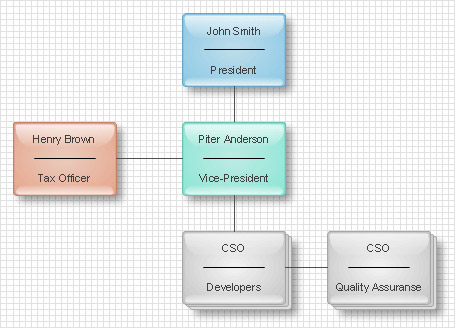
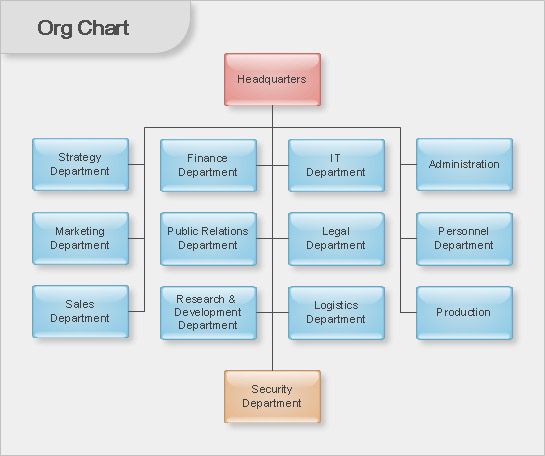
An Organizational chart represents the structure of an organization in terms of work responsibility and rank position. It is a very convenient format for visually displaying formal relationships, in any size organization. Typically, an Organizational chart is made up of rectangular object blocks, that represent a job title, name of person, and the relationships associated with them.

There are several types of object block relationships in an Organizational chart:

  • Line:
    Direct relationships between superior and subordinate.

  • Lateral:
    Relationships between different departments on the same level of hierarchy.

    Organization chart: Lateral

  • Staff:
    Relationships between a managerial assistant and other employees.

    Organization chart: Staff

  • Functional:
    Relationships between contractors and other employees.

    Organization chart: Functional

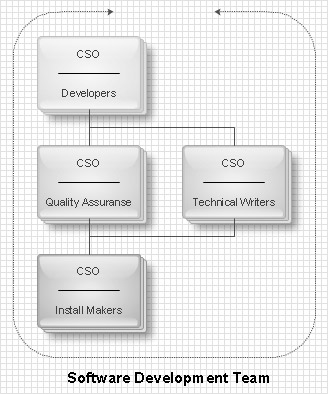
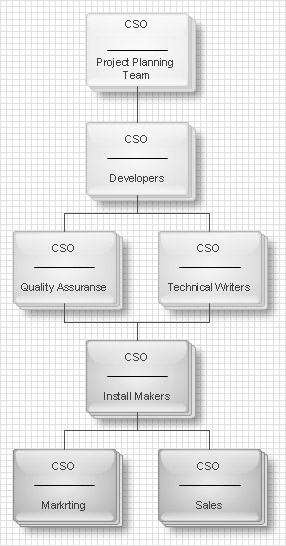
One of the main features of an organizational chart is its ability to be divided into smaller charts. This is convenient for large organizations with a more complex branched structure.

There are three different types of organizational charts:

  • Hierarchical:
    Describes the organizational hierarchy.

    organizational chart: Hierarchical

  • Matrix:
    Structure of an organization is categorized by types of job functions. All employees are organized by their role in the company, regardless of their position in the hierarchy.

    organizational chart: Matrix

  • Flat:
    People are oriented by work processes.

    organizational chart: Flat

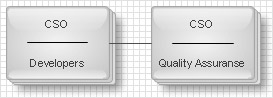
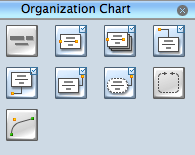
With ConceptDraw DIAGRAM you can quickly and easily create any type of organizational chart. ConceptDraw DIAGRAM includes numerous organizational chart templates for the simple to complex multi-page charts.

Organizational Charts Solution in ConceptDraw STORE

You can easily create a professional organizational chart with the help of object shapes from the Organization Chart Library. Here you will find various types of object blocks, connectors, and shapes depicting department or groups.

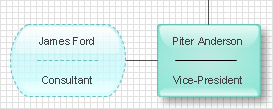
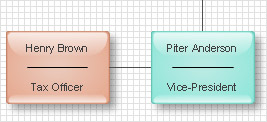
To begin building a chart, just drag object blocks representing different job positions onto the ConceptDraw DIAGRAM workspace. Arrange objects in the appropriate order and use connectors to show the relationships with each other.

NOTE: Connected blocks remain connected even when they are moved in the workspace.

One of the challenges of organizational charts is the requirement for regular updating. However, with ConceptDraw DIAGRAM reformatting and making modifications to chart details is fast and easy as shapes remain connected when they are moved, and position object blocks have editable functionality.

Relationships between employees can be described in detail using text notes, or by using colors or different formatting to distinguish them. For example, you can use dotted lines to demonstrate a low priority relationship, and thick lines to emphasize higher priority ones.

Organizational Chart Samples:

Org Chart

Organizational Charts with ConceptDraw DIAGRAM  *

TEN RELATED HOW TO's:
Any business process consists from a number of tasks carrying out the certain business goal. It is useful to diagram business processes to ensure that they are as foolproof, logical and sequential as possible. This business process diagram describes a typical booking process flow by the example of a cab booking process. It can be used as a roadmap for any booking system implementation. Diagramming a business process allows you to look at the entire project and take into account all types of possible scenarios. Business process diagram helps you investigate and clarify the process thoroughly so that you can find out how it can be improved. Business process diagram supports team communications by ensuring that each process element is clear and everyone in the team is on the same page. Sometimes your company brings you less profit than you expect it to be, and it’s difficult to reveal the causes. Maybe it’s time to learn new technologies, because business diagram are easily developed by means of special software, so you won’t make any extra effort. In return, you will increase your productivity and get more done in a less time.Business Diagram Software *
Picture: Business Diagram Software
Related Solutions:
Electrical plan is a document that is developed during the first stage of the building design. This scheme is composed of conventional images or symbols of components that operate by means of electric energy. To simplify the creation of these schemes you can use house electrical plan software, which will not require a long additional training to understand how to use it. You only need to install the necessary software ant it’s libraries and you’ll have one less problem during the building projection. Any building contains a number of electrical systems, including switches, fixtures, outlets and other lightening equipment. All these should be depicted in a building electrical plans and included to general building documentation. This home electrical plan displays electrical and telecommunication devices placed to a home floor plan. On the plan, each electrical device is referenced with the proper symbol. Electrical symbols are used for universal recognition of the building plan by different persons who will be working on the construction. Not all possible electric symbols used on a certain plan, so the symbols used in the current home plan are included to a legend. The electrical home plan may be added as a separate document to a complete set of building plans.House Electrical Plan Software
Picture: How To use House Electrical Plan Software
Related Solution:
There are many tools to manage a process or to illustrate an algorithm or a workflow. Flowcharting is one of those tools. However, it may be difficult to show complex processes that require multiple attributes or several people in a simple flowchart, so a cross-functional flowchart would be a solution for that situation. To create such flowchart, group processes and steps to labeled rows or columns, and divide those groups with horizontal or vertical parallel lines. It is worth mentioning that there are different types of cross-functional flowcharts, like opportunity or deployment flowchart. This diagram shows a cross-functional flowchart that was made for a trading process. It contains 14 processes, distributed through 5 lines depicting the participants who interact with the process. Also there are connectors that show the data flow of information between processes. The cross-functional flowchart displays a detailed model of the trading process, as well as all participants in the process and how they interact with each other. The lines in the flowchart indicates the position, department and role of the trading process participants.Cross-Functional Flowchart
Picture: Cross-Functional Flowchart
Related Solution:
What is organizational charts and why your business need them? How to use business process diagram software? Explore how advanced organization chart software transforms the way companies ✔️ visualize, ✔️ communicate, and ✔️ streamline their organizational hierarchiesOrganogram Software
Picture:
What is an Organizational Chart and how it works?
Organization Chart Software
Related Solution:
While creating flowcharts and process flow diagrams, you should use special objects to define different statements, so anyone aware of flowcharts can get your scheme right. There is a short and an extended list of basic flowchart symbols and their meaning. Basic flowchart symbols include terminator objects, rectangles for describing steps of a process, diamonds representing appearing conditions and questions and parallelograms to show incoming data. This diagram gives a general review of the standard symbols that are used when creating flowcharts and process flow diagrams. The practice of using a set of standard flowchart symbols was admitted in order to make flowcharts and other process flow diagrams created by any person properly understandable by other people. The flowchart symbols depict different kinds of actions and phases in a process. The sequence of the actions, and the relationships between them are shown by special lines and arrows. There are a large number of flowchart symbols. Which of them can be used in the particular diagram depends on its type. For instance, some symbols used in data flow diagrams usually are not used in the process flowcharts. Business process system use exactly these flowchart symbols.Flowchart example showing a customer request approval process with start, input output, process steps, decision branches, and end
Picture: Flowchart Symbols: Meaning and Examples
Related Solution:
A flowchart is a powerful tool for examining processes. It helps improving processes a lot, as it becomes much easier to communicate between involved people, to identify potential problems and to optimize workflow. There are flowcharts of different shapes, sizes and types of flowchart vary from quite basic process flowcharts to complex program flowcharts. Nevertheless, all these diagrams use the same set of special symbols like arrows to connect blocks, parallelogram to show data receiving or rectangles for showing process steps. Basic flowcharts are used to represent a simple process algorithm. A basic flowchart notation consists of rectangles (business processes), arrows (the flow of information, documents, etc.). The same notation is used in items such as the "decision", which allow you to do the branching. To indicate the start of the entire business process and its termination can be used the "Terminator" element. The advantages of Basic Flowchart are simplicity and clarity. With it you can quickly describe the business process steps. Creating of Basic Flowchart does not require any special knowledge, as easily understand by employees with different levels of education and IQ.Types of Flowchart — Overview
Picture: Types of Flowchart: Comprehensive Overview
Related Solution:
This sample shows the Flowchart of the testing the work of the lamp and decision making about what to do to lamp will work.Samples of Flowchart *
Picture: Samples of Flowchart
Related Solution:
This sample was created in ConceptDraw DIAGRAM diagramming and vector drawing software using the Flowcharts solution from the Diagrams area of ConceptDraw Solution Park. This sample shows the Flowchart of the Subprime Mortgage Crisis. This Flowchart describes the decline in housing prices when the housing bubble burst and what it caused on the housing and financial markets. You can also see the Government and Industry responses in this crisis situation.Flowchart on Bank. <br>Flowchart Examples *
Picture: Flowchart on Bank. Flowchart Examples
Related Solution:
There are plenty of diagramming tools, the question is to choose the most suitable for your needs. For example, you can choose ConceptDraw DIAGRAM as organizational chart software and get fascinating results in a few minutes. An orgchart is useful for any corporation. This is an example of a hierarchical organization scheme of the company. It has tree-like structure. Each middle manager is subordinated to a few employees, and he is accountable to one of the top managers. Every type of organizational composition of businesses may be presented in the view of an organizational chart that is supported by ConceptDraw Organisational Charts solution. There are number of ways of building a structure of business organization, establishing how it should function.ConceptDraw DIAGRAM - Organizational chart software *
Picture: ConceptDraw DIAGRAM - Organizational chart software
Related Solution:
A flowchart is a simple but very functional tool when it comes to understanding a workflow or to removing unnecessary stages from a process. When drawing flowcharts, keep in mind that there are four common types of flowcharts, like document flowcharts and data flowcharts that show control over a data or document flow over a system. To show controls on a physical level, use system flowcharts. In addition, to show controls in a program, you can draw a program flowchart. This flowchart diagram represents the piece of an article editing process, that involves the author and editor. It was created using the Basic Flowchart notation that consists from the basic flowchart symbols. The start and the end of the process are indicated with "Terminator" symbols. The "Process" symbols show the action steps consisting from making edits and searching for a compromise, when the author does not agree with the suggestions of the editor. The "Process" symbol is the general symbol in process flowcharts. The "Decision" symbol indicates a branching in the process flow. There are two branches indicated by a Decision shape in the current flowchart (Yes/No, Disagree/Agree). This basic flowchart can be used as a repeating unit in the workflow diagram describing the working process of some editorial office.Types of Flowcharts *
Picture: Types of Flowcharts
Related Solution:
ConceptDraw
DIAGRAM 18