TEN RELATED HOW TO's:
Have you ever used dashboards? You probably have, and not just once. Speedometer, tachometer, fuel and oil level indicators, clock, and GPS – this is a typical set of instrumentation that can be found on a car dashboard. Even though all of these indicators are present, an experienced driver feels the speed and engine rpm with sufficient accuracy without looking at the dashboard consistently. The dashboard is an important tool in the car, but not necessarily an irreplaceable one: we need all these indicators to be available while driving, but for 99% of the time they are superfluous.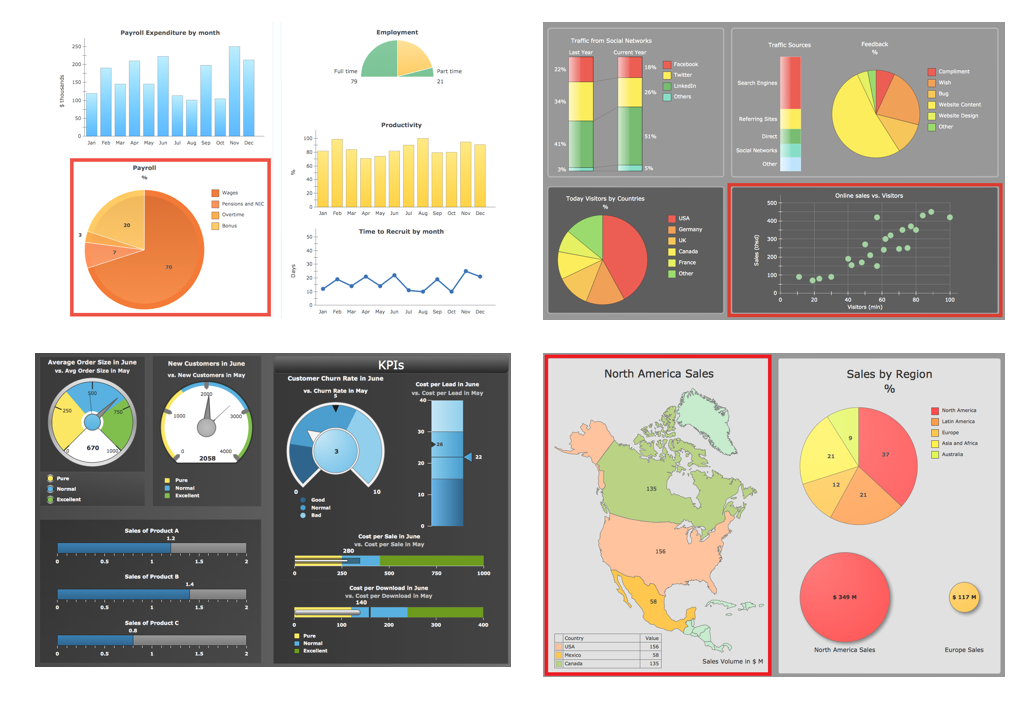
Picture: Making Dashboards Useful Again. Part 0.
Related Solution:
All about prototyping. GUI Prototyping with ConceptDraw. Download prototyping software.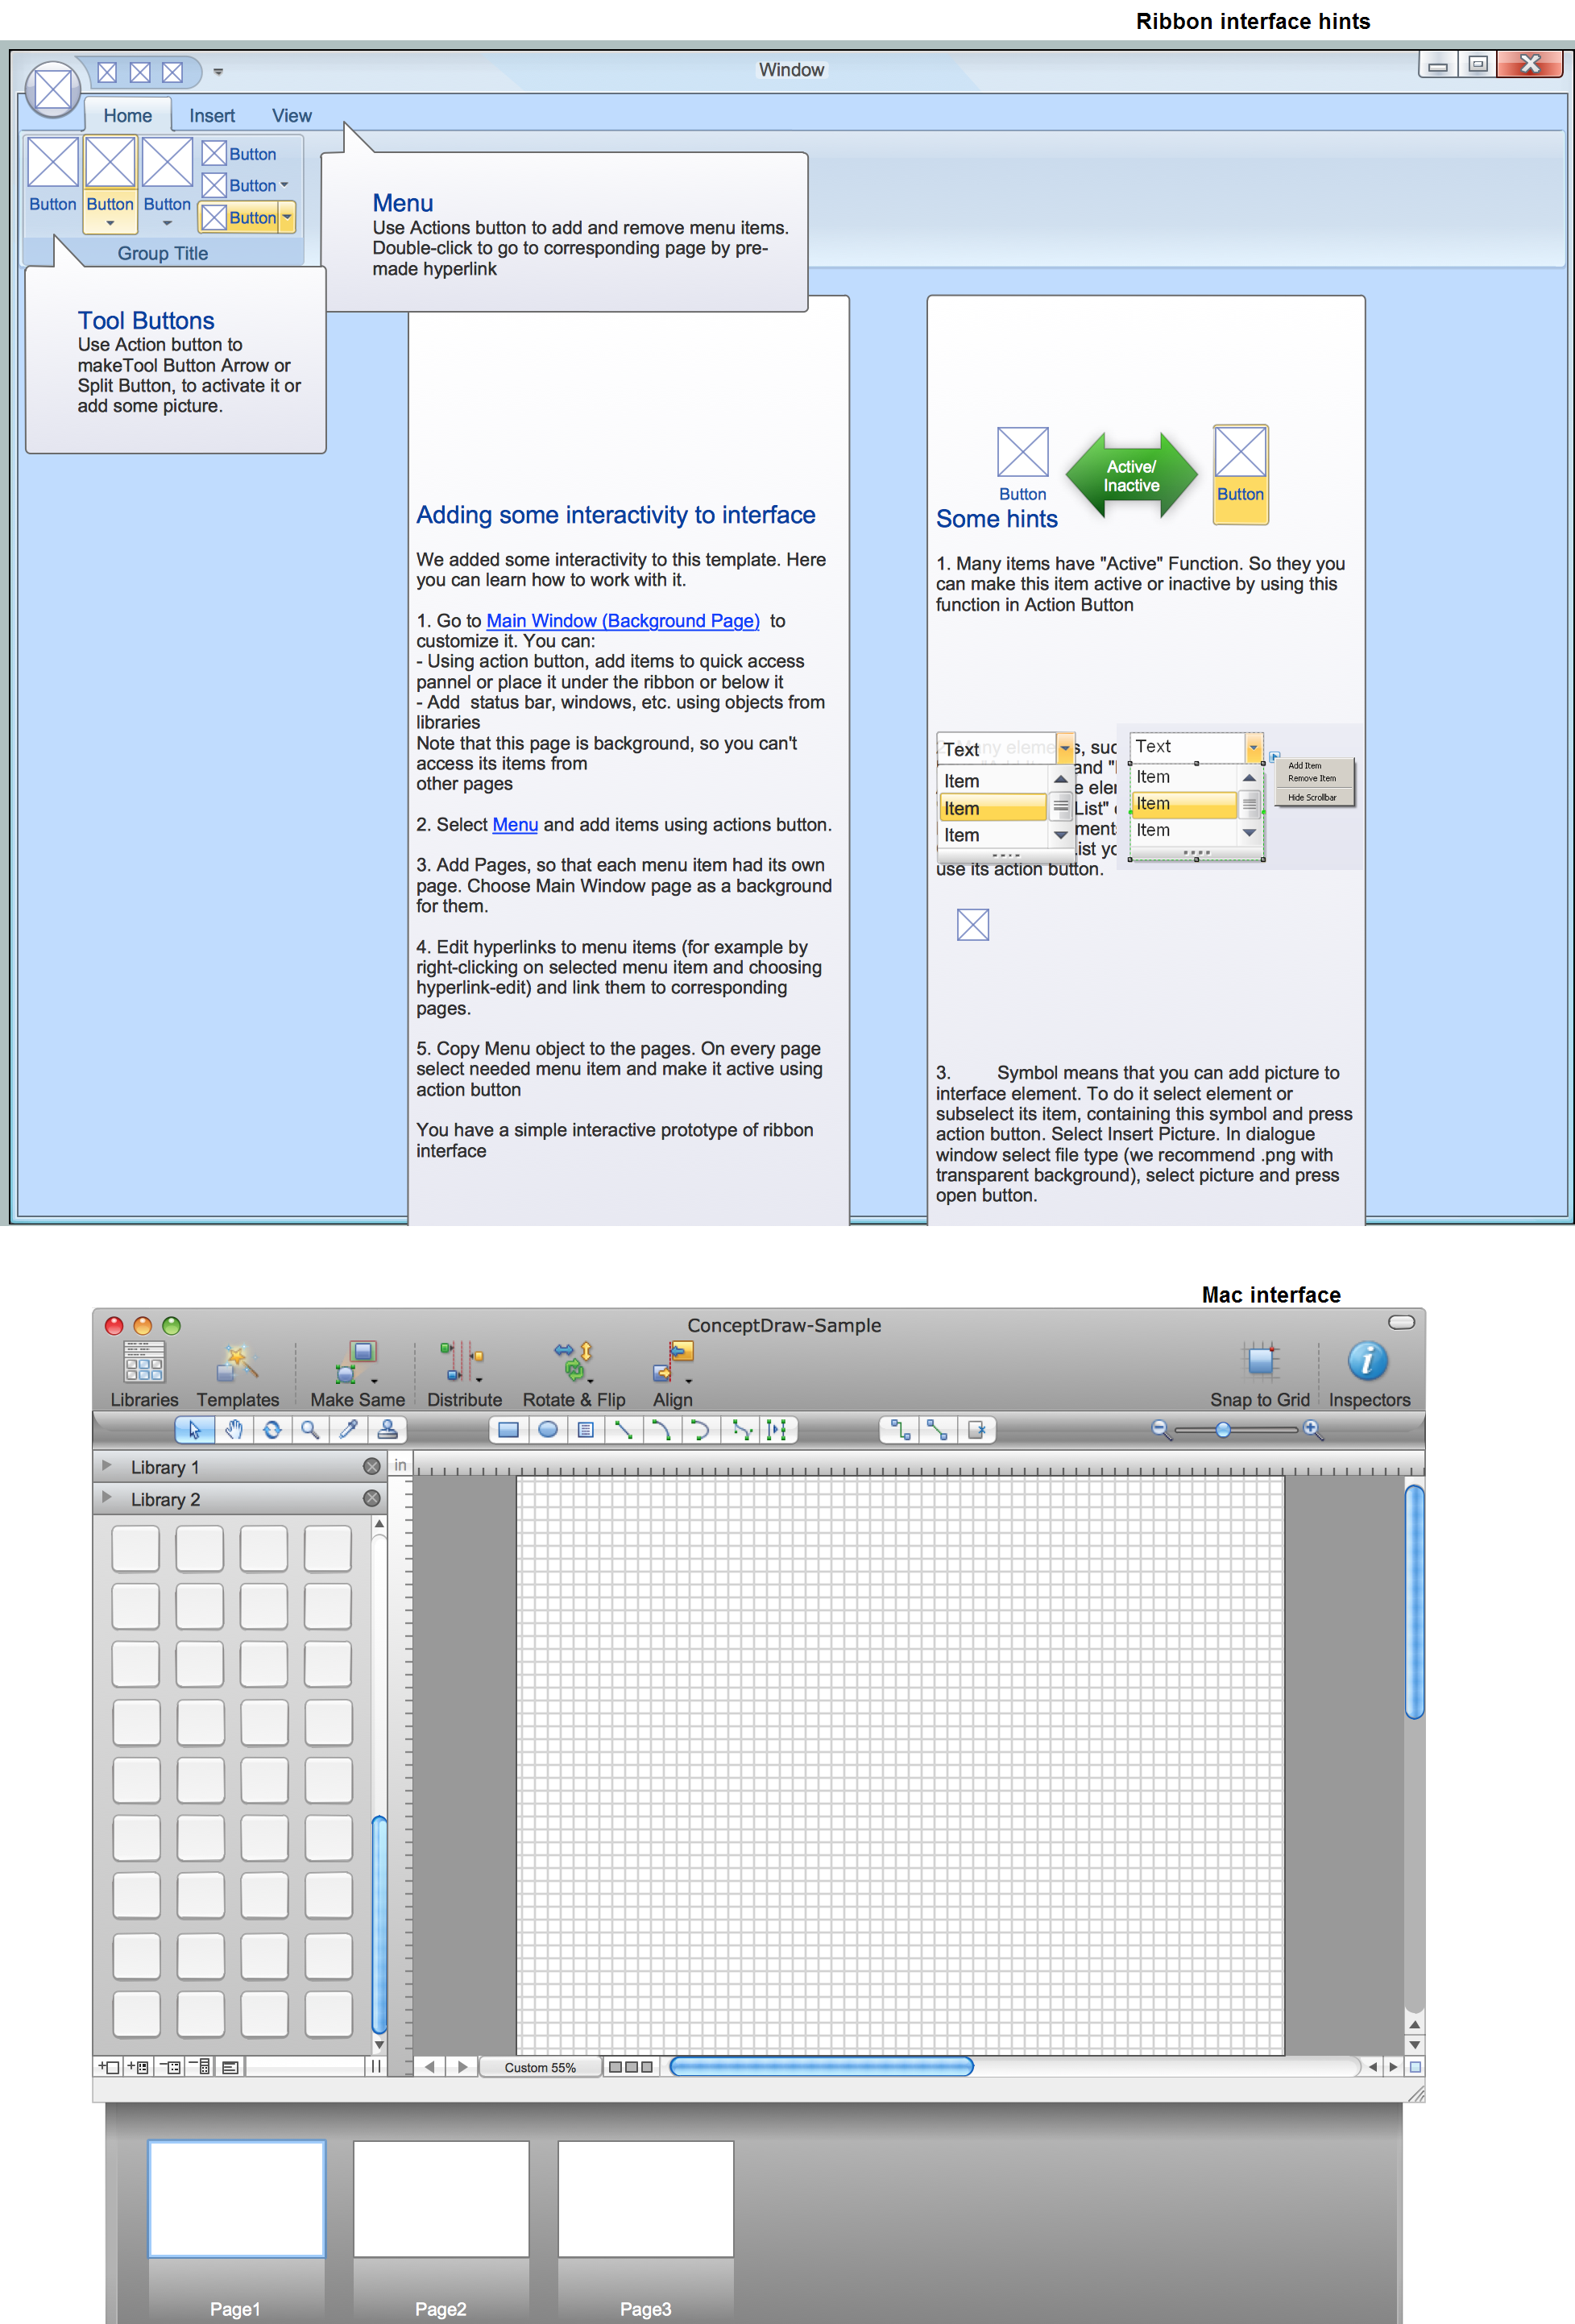
Picture: GUI Prototyping with ConceptDraw DIAGRAM
Swimlanes are a visual mechanism of organizing and categorizing activities, in BPMN consist of two types: Pool, Lane. Use ConceptDraw Swimlanes library with 20 objects from BPMN.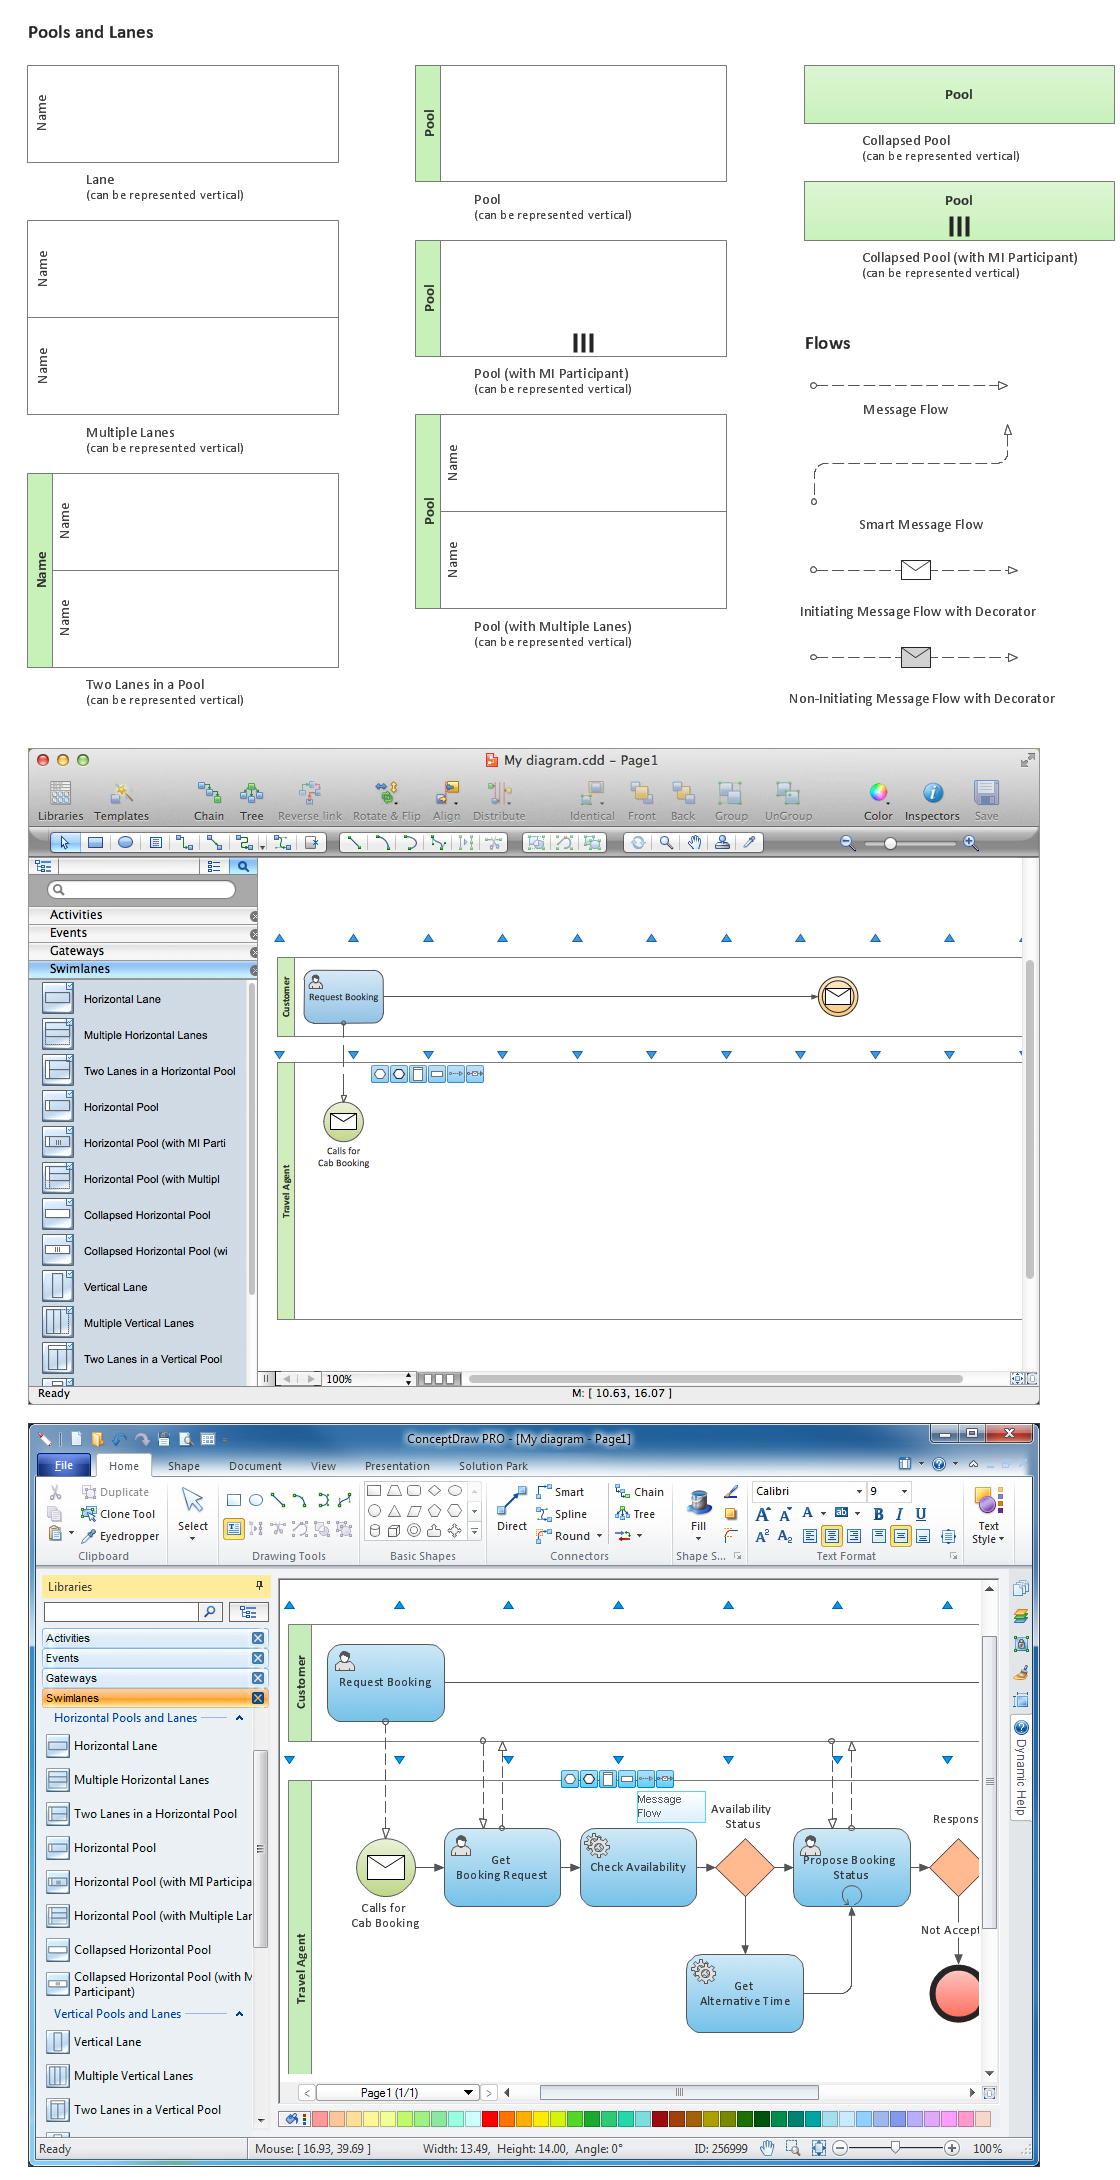
Picture: Diagramming Software for Design Business Process Diagrams
ConceptDraw DIAGRAM software is a great assistant in electrical engineering and electrical design. It is efficient in creating ✔️ complex and simple electrical designs, ✔️ power generation, transmission, and distribution electrical schematics, ✔️ transformers diagrams, ✔️ electrical schematics with transformers
Picture: Electrical Symbols — Transformers and Windings
Related Solution:
How to draw Telecommunications Network Diagram quick, easy and effective? ConceptDraw DIAGRAM offers the unique Telecommunication Network Diagrams Solution from the Computer and Networks Area which will help you.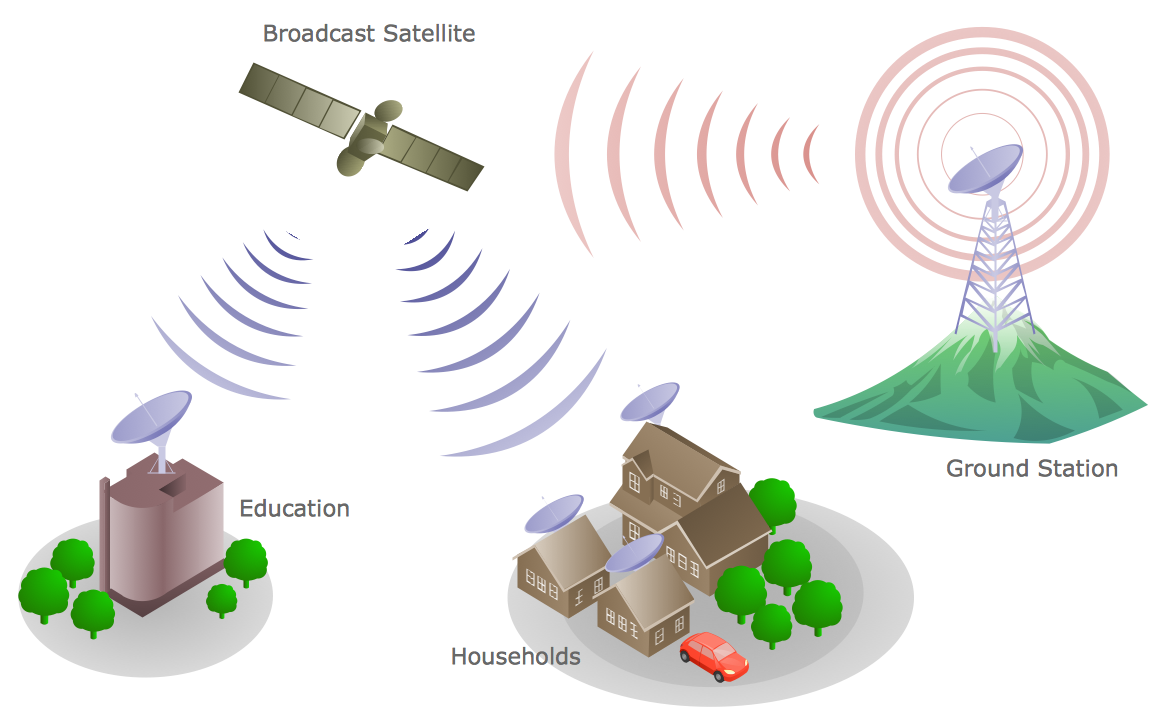
Picture: Telecommunications Network
Related Solution:
There are several types of insulated gate field-effect transistors (IGFETs) in common use.
The early term metal oxide semiconductor field-effect transistor (MOSFET) is still in
use, and MOSFET is usually acceptable as a generic term for IGFETs. The metal oxide, and the insulation in the IGFET, is the insulating material between the gate terminal and the substrate between the source and drain terminals. This insulator must have very low leakage, of course, but another requirement for good performance of the transistor is that the dielectric constant of the material must be very high.
26 libraries of the Electrical Engineering Solution of ConceptDraw DIAGRAM make your electrical diagramming simple, efficient, and effective. You can simply and quickly drop the ready-to-use objects from libraries into your document to create the electrical diagram.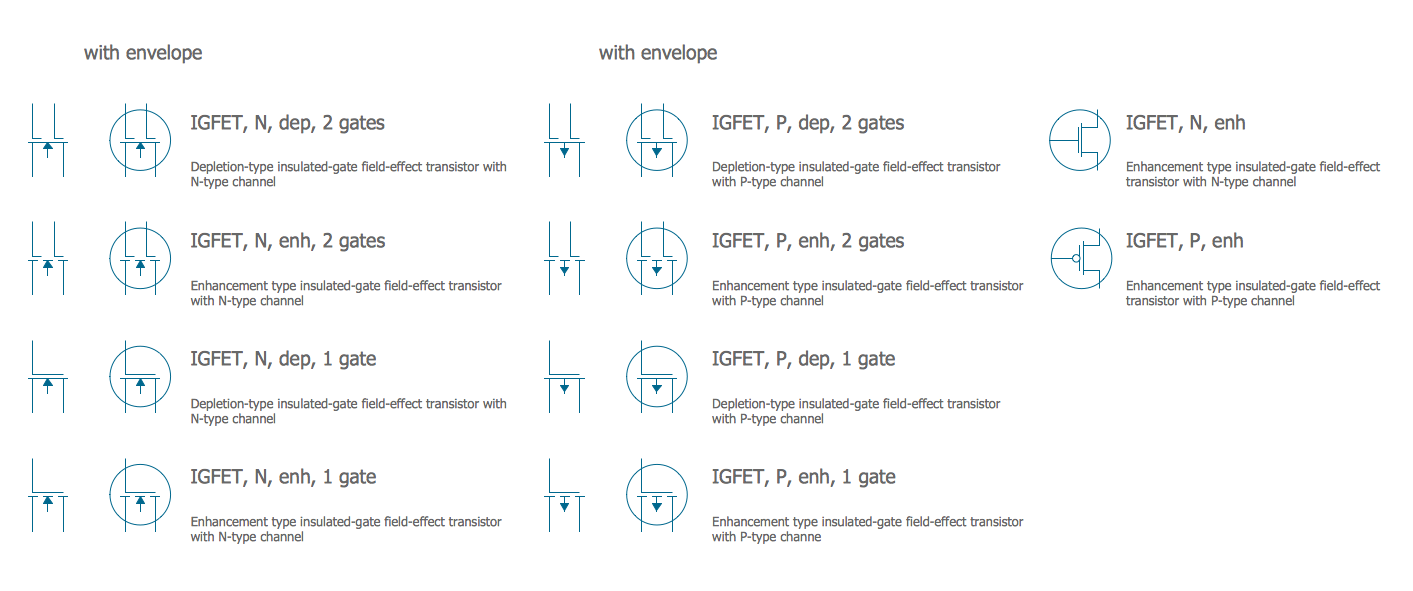
Picture: Electrical Symbols — IGFET
Related Solution:
Have you ever needed a flowchart, but did not have the time or tools to build one? Rapid Draw allows you to build a professional flowchart quickly and easily. You have the ability to add your own shapes to Rapid Draw’s built in shape library.
Picture: How To Create a FlowChart using ConceptDraw
Related Solution:
IT world is extremely rational and logical. So what can be more precise than Software Diagrams to rate the results of work? Visual statistics is the best way to understand the data.
This figure demonstrates the data flow diagram (DFD), which was created to describe the electronic system of custom purchase. This is the process of buying using electronic bar code scanning system. Such systems are used in large stores. The cashier scans the bar code, the system outputs the data on the price of the goods and carries out a purchase process. This DFD utilizes the Gane/Sarson notation. To create it The ConceptDraw DFD solution has been applied.
Picture: Software Diagrams
ConceptDraw helps you to start designing your own UML Collaboration Diagrams with examples and templates.
Picture: Diagramming Software for Design UML Collaboration Diagrams
When talking about engineering, one should define all the terms used, so anybody could understand the topic. Typical network glossary contains definitions of numerous network appliances, types of networks and cable systems. The understanding of basic is crucial for server management, network administration and investigating problems.
The network glossary defines terms related to networking and communications. The most of glossary items has their visual representation in ConceptDraw DIAGRAM libraries of the Computer Network Diagrams solution. This illustration presents a local area network (LAN) diagram. It designed to show the way the interaction of network devices in a local network. The diagram uses a library containing symbols of network equipment, connections and the end-point devices such as network printer, hubs, server, modem and finally computers (PC, mac, laptop). This diagram depicts a physical LAN topology.
Picture: Network Glossary Definition
Related Solution:
