
Pic.1. Printing in ConceptDraw Project
When planning, you can generate and print reports as part of your project documents, including schedule and milestone data, budget data, and resource plans. Because these documents are generated from a common data source, you can update them quickly as the project evolves. The ease of generating reports, gathering input, and collaborating with teams means that your project plans are carefully considered and vetted before you begin project execution.
TEN RELATED HOW TO's:
ConceptDraw DIAGRAM Software is a cross-platform flowcharting tool with extended HTML capabilities. It contains more than 10 000 pre-created objects and many templates, available for PC and Macintosh.
Creating great designs and diagrams involves having the right drawing software. ConceptDraw is the business diagram software of choice for business professionals who need to quickly and easily visualize, explore, and communicate information.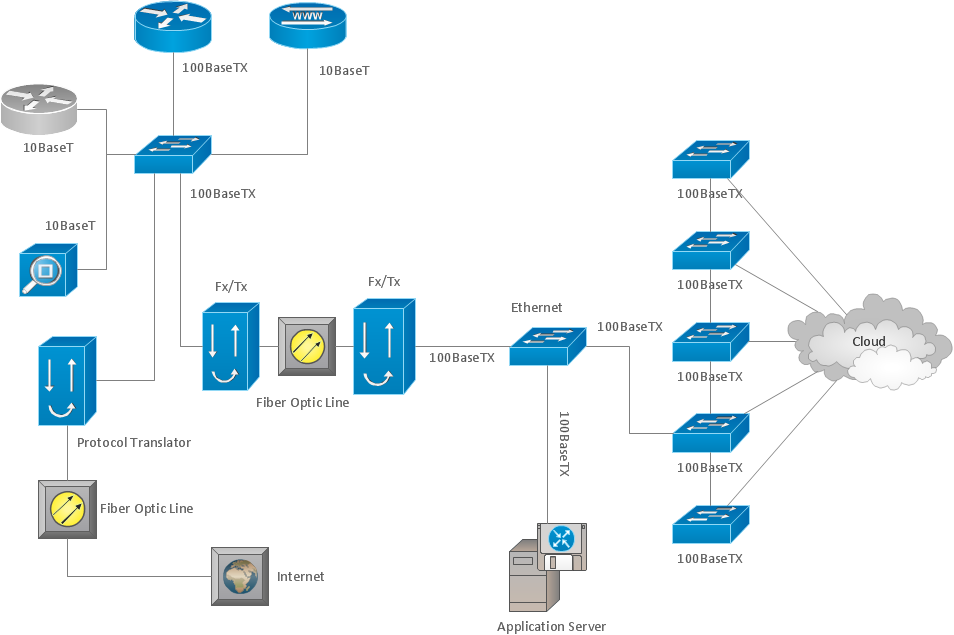
Picture: Business and Software Diagrams
An advanced tool for creating presentations, if you decide to represent data without spending hours on that.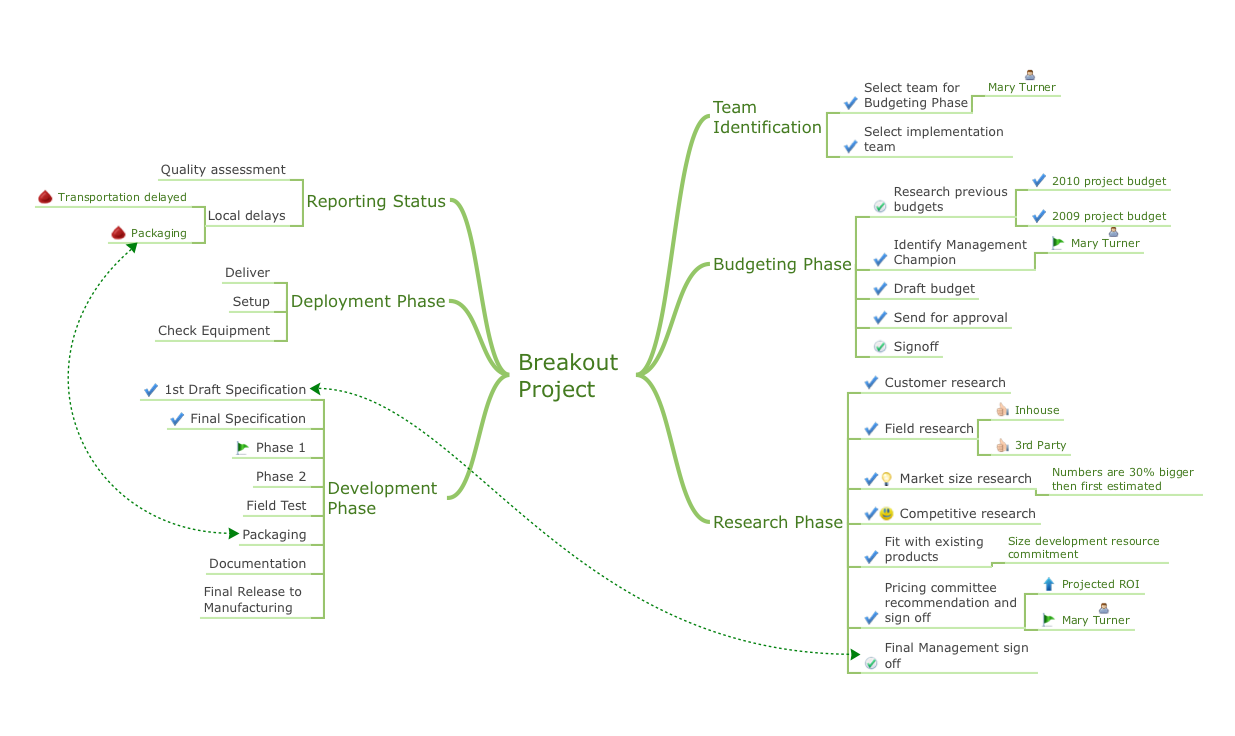
Picture: Best Software for Making Presentations
Related Solution:
Create great presentations with ConceptDraw easily.
Picture: How to Create a Great Presentation
Related Solution:
Garrett IA diagrams are used at development of Internet-resources, in particulars at projecting of interactions of web-resource elements. The diagram of information architecture of the web resource which is constructed correctly with necessary details presents to developers the resource in comprehensible and visual way.
Picture: Garrett IA Diagrams with ConceptDraw DIAGRAM
Use ConceptDraw DIAGRAM software as a powerful audit application. 🔸 Create professional Audit Workflow Diagrams and Audit Process Flowcharts to ✔️ plan and implement audit process, ✔️ enhance financial transparency, ✔️ improve financial reporting, ✔️ streamline operations, ✔️ improve business efficiency, ✔️ identify risks and issues, ✔️ prevent financial fraud, ✔️ track progress, ✔️ enhance trust
Picture: Understanding the Audit Process: A Comprehensive Guide. Audit Process Flowchart
Related Solution:
It’s not easy to plan all the details of your landscape at once. Therefore, you can use a bubble diagram to create a draft of the future project. You can develop any bubble diagrams and use them in your landscape design project with ConceptDraw DIAGRAM and it’s predesigned templates.
This bubble diagram can be applied while initiating the development of garden and landscape design. The bubble diagrams used for this purpose are different from the classic bubble diagrams. Being used in landscape and garden design, they obtain the quite another understanding. Bubbles in this diagram visualize some captured areas, which define the general spaces of a future garden: lawn, flower garden, pool, built-up area, lighting, etc. The bubble diagram represents the landscape project without any special expenses on its creation. It is better to make such simple sketch before you drill down into detailed project and cost estimates.
Picture: Bubble diagrams in Landscape Design with ConceptDraw DIAGRAM
ConceptDraw MINDMAP Mac OS X version enables you to export your mind map into the iCal calendar and generate tasks from mind map topics.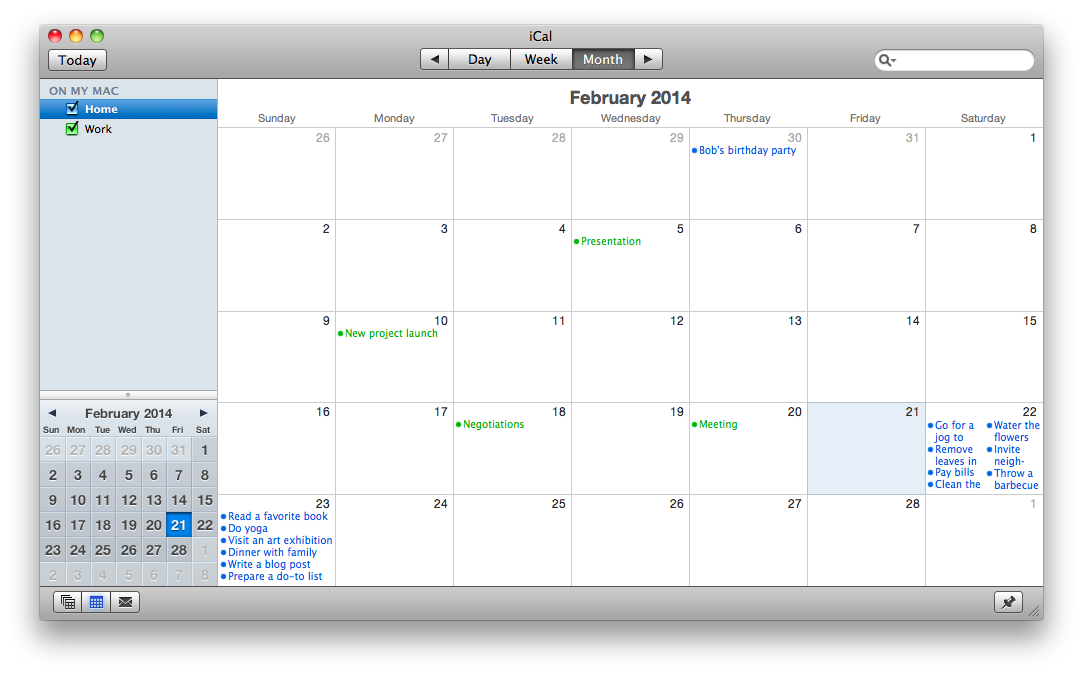
Picture: Export from ConceptDraw MINDMAP to Apple iCal
Related Solution:
A waterfall model describes software development process as a sequence of phases that flow downwards. SSADM is one of the implementations of waterfall method. It’s easier to learn about structured systems analysis and design method (SSADM) with ConceptDraw DIAGRAM because this software has appropriate tools for creating data flow diagrams. You can use all the three main techniques of SSADM method with special tools and predesigned templates.
This data flow diagram illustrates the Structured Systems Analysis and Design Method. This method method considers analysis, projecting and documenting of information systems. Data flow models are the most important elements of SSADM and data flow diagrams are usually used for their description. It includes the analysis and description of a system as well as visualization of possible issues.
Picture: Structured Systems Analysis and Design Method. SSADM with ConceptDraw DIAGRAM
Related Solution:
Network Diagrams visualize schematically the computer networks topology, equipment nodes and different types of their logical and physical connections. They are widely used by IT professionals to visually document the topology and design of computer and telecommunication networks.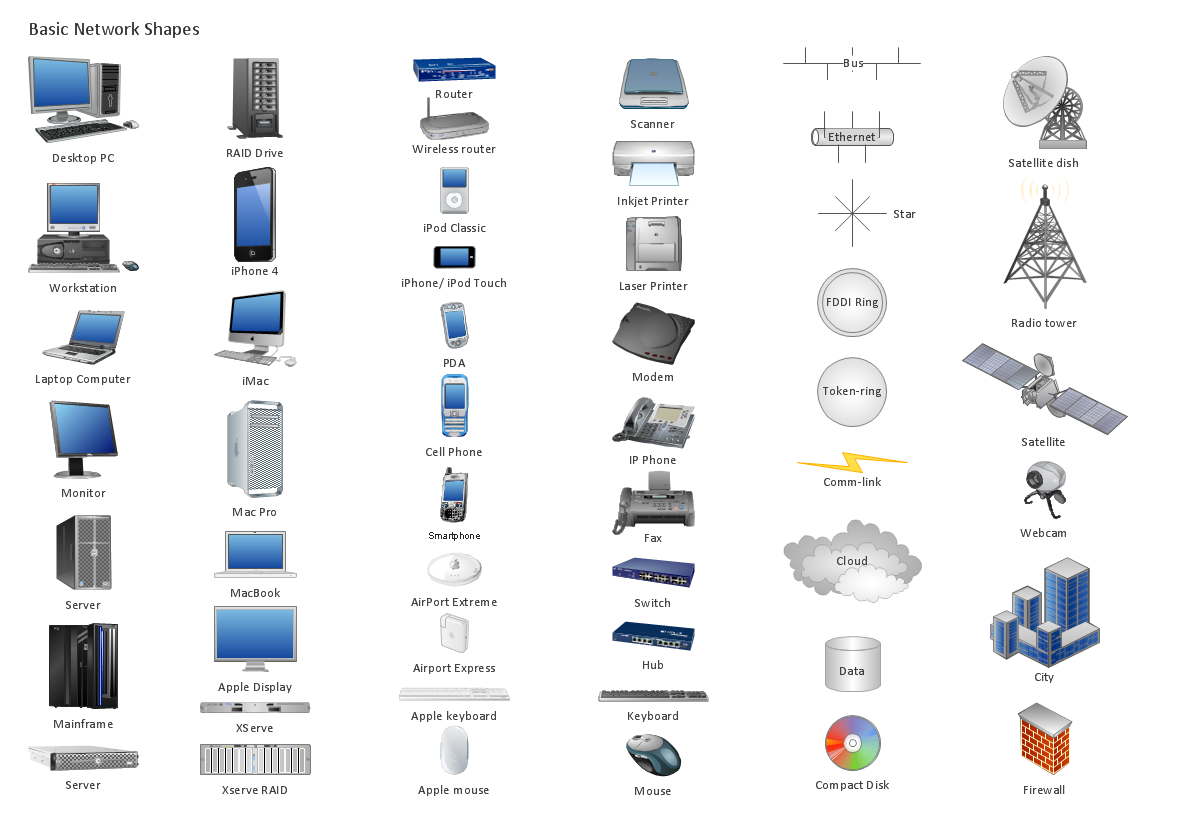
Picture: Computer Networking Tools List
Related Solution:
If you are an advanced diagramming software user, you might use it daily. Traversing the Internet in searching of alternative to MS Visio for MAC and PC, you can fulfill all your requirements with ConceptDraw DIAGRAM. Don’t hesitate to transfer your documents to another operating system.
When looking for a smart and simple tool for business diagrams as alternative to MS Visio for Apple OS X platform, ConceptDraw DIAGRAM certainly is the best choice. Making many kinds of business charts, numerous technical drawings is what ConcepDraw DIAGRAM is the best. One can easy create any diagram and complete it perfectly and quickly. The big collection of vector object libraries, templates and samples, make it the best Microsoft Visio alternative: ConceptDraw DIAGRAM is simpler to use, less expensive, and supports project management and mind mapping methods.
Picture:
In Searching of Alternative to MS Visio for Mac and PC
with ConceptDraw DIAGRAM