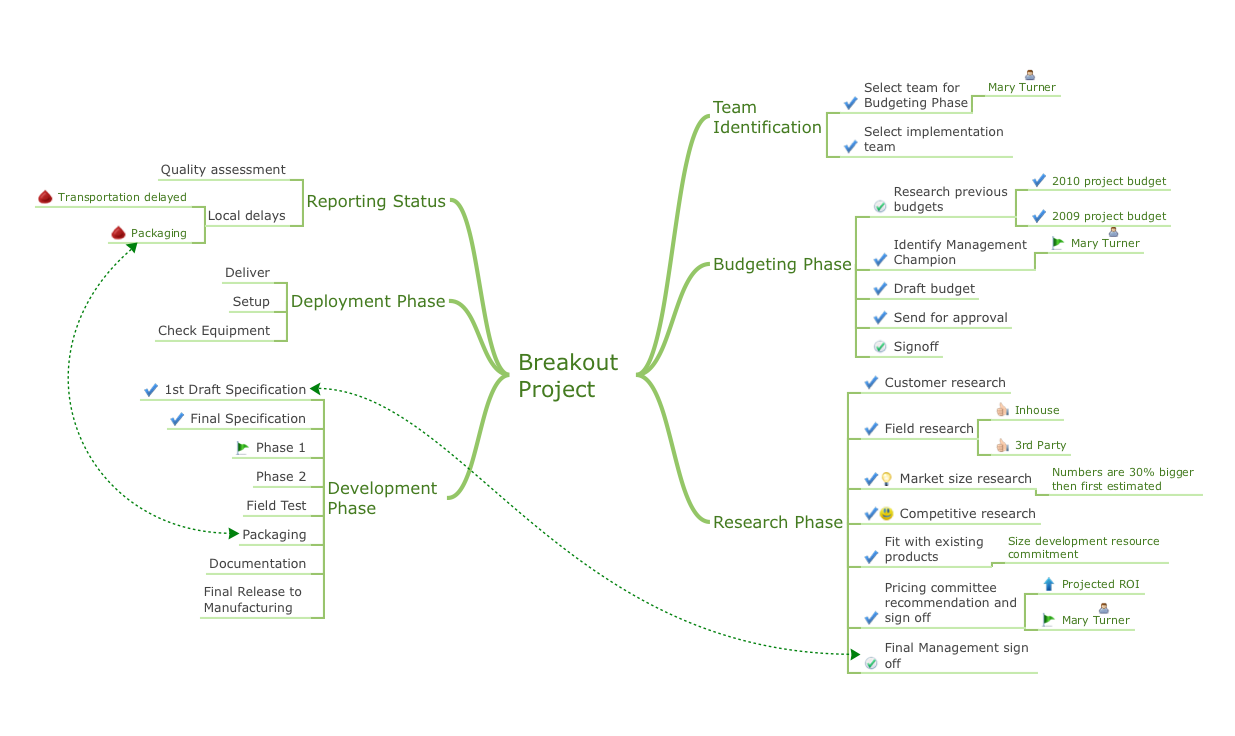
Sample 1. Mind map presentation - Breakout project.
Presentation Exchange solution extends ConceptDraw MINDMAP with the ability to import presentations from Microsoft® PowerPoint®, as well as enhancing its existing presentation capabilities.
With the Presentation Exchange solution you can easily extract the content from a PowerPoint presentation to see how it all fits together in a single view. You can review slide content, see how the slides support one another, and refine the story.
TEN RELATED HOW TO's:
ConceptDraw PROJECT contains an extensive tool set to help project managers. The rich data visualization capability that is provided by ConceptDraw products helps you create project dashboards, one-click reports, multi-project views, Gantt charts, and resource views. Let′s learn how to get maximum value using ConceptDraw PROJECT!
Picture: How To Create Project Report
There are numerous articles about the advantages of flowcharting, creating business graphics and developing different charts. Nevertheless, these articles are almost useless without the main component - the examples of flowcharts, org charts and without a fine example, it is difficult to get all the conveniences of creating diagrams. You can find tons of templates and vivid examples on Solution Park.
This illustration shows a variety of business diagrams that can be created using ConceptDraw DIAGRAM. It comprises a different fields of business activities: management, marketing, networking, software and database development along with design of infographics and business illustrations. ConceptDraw DIAGRAM provides a huge set of sample drawings including business process modeling diagrams,, network diagrams, UML diagrams, orgcharts, DFD, flowcharts, ERD, geographical maps and more.
Picture: Examples of Flowcharts, Org Charts and More
Related Solution:
Interactive tool helps you find the appropriate response to social media mentions quickly.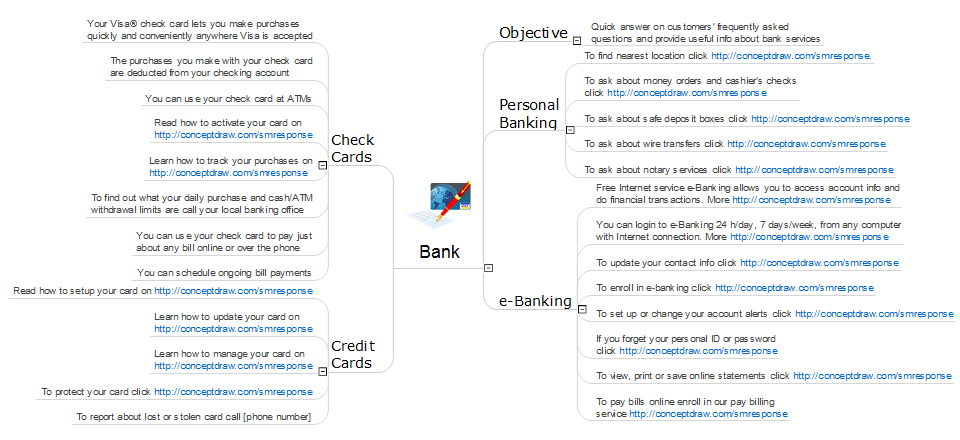
Picture: What Is an Action Mind Map
Related Solution:
The intuitive interface of ConceptDraw MINDMAP and the Functional Tools overview below will guide you in creating and demonstrating powerful mind map presentations using template.
An advanced tool allows you effectively generate, change, and update your presentation.
Picture: Create a Presentation Using a Design Template
Related Solution:
A lot of business process techniques are able to be applied in regular life. Although this tool is considered to be used for business purposes, you can make a SWOT template for yourself. In fact, any obstacle might become a subject for SWOT analysis.
ConceptDraw solution for SWOT analysis solution provides a power visual maintenance of a SWOT analysis. It is a procedure of strategic planning made to discover the Strengths, Weaknesses, Opportunities, and Threats business meet. This mind map template for ConceptDraw MINDMAP isually maintains investigation of good and bad factors. For example, factors that provides an advantage over others are strength; factors that brings a disadvantage are factors of weakness. After the analysis is finished, transfer your data to create a SWOT matrix in ConceptDraw DIAGRAM.
Picture: SWOT Template
Create flowcharts, organizational charts, bar charts, line graphs, and more with ConceptDraw DIAGRAM.
Picture: Basic Diagramming
Related Solution:
Visio for Mac and Windows - ConceptDraw as an alternative to MS Visio. ConceptDraw DIAGRAM delivers full-functioned alternative to MS Visio. ConceptDraw DIAGRAM supports import of Visio files. ConceptDraw DIAGRAM supports flowcharting, swimlane, orgchart, project chart, mind map, decision tree, cause and effect, charts and graphs, and many other diagram types.
Picture: Is ConceptDraw DIAGRAM an Alternative to Microsoft Visio?
Once you have created your document in ConceptDraw DIAGRAM and you want to share it with your colleagues and friends, who uses MS Visio on their computers, you can easily export your document using ConceptDraw DIAGRAM export to Visio XML files (VDX) feature.
Now you can share your ConceptDraw documents with MS Visio users.
Picture: Export from ConceptDraw DIAGRAM Document to MS Visio® XML
Fishbone Diagram, also referred as Cause and Effect diagram or Ishikawa diagram, is a fault finding and problem solving tool. Construction of Ishikawa diagrams is quite complicated process and has a number of features.
Fishbone Diagrams solution included to ConceptDraw Solution Park contains powerful drawing tools and a lot of examples, samples and templates. Each Fishbone diagram example is carefully thought-out by experts and is perfect source of inspiration for you.
Picture: Fishbone Diagram Example
Related Solution:
For vector shapes and connector tools for quick and easy drawing diagrams for business, technology, science and education - The best choice for Diagramming is ConceptDraw DIAGRAM.
Picture: Diagram Software - The Best Choice for Diagramming