Value Stream Mapping Presentations
The Value Stream Mapping solution from ConceptDraw Solution Park extends ConceptDraw DIAGRAM software with a new library of the vector stencils. With this well-designed objects users can draw Value Stream Mapping diagram. Also users can create Value Stream Mapping Presentations using presentation mode in ConceptDraw DIAGRAM

Pic.1 Diagram - Value stream mapping.
This VSM diagram is available in Value Stream Mapping solution from ConceptDraw Solution Park. The diagrams created using ConceptDraw DIAGRAM software you can convert into PowerPoint presentations.
See also Samples:
TEN RELATED HOW TO's:
The Value Stream Mapping solution found in the ConceptDraw Solution Park continues to extend the range of ConceptDraw DIAGRAM into a business graphics tool that can be used to document processes in any organization.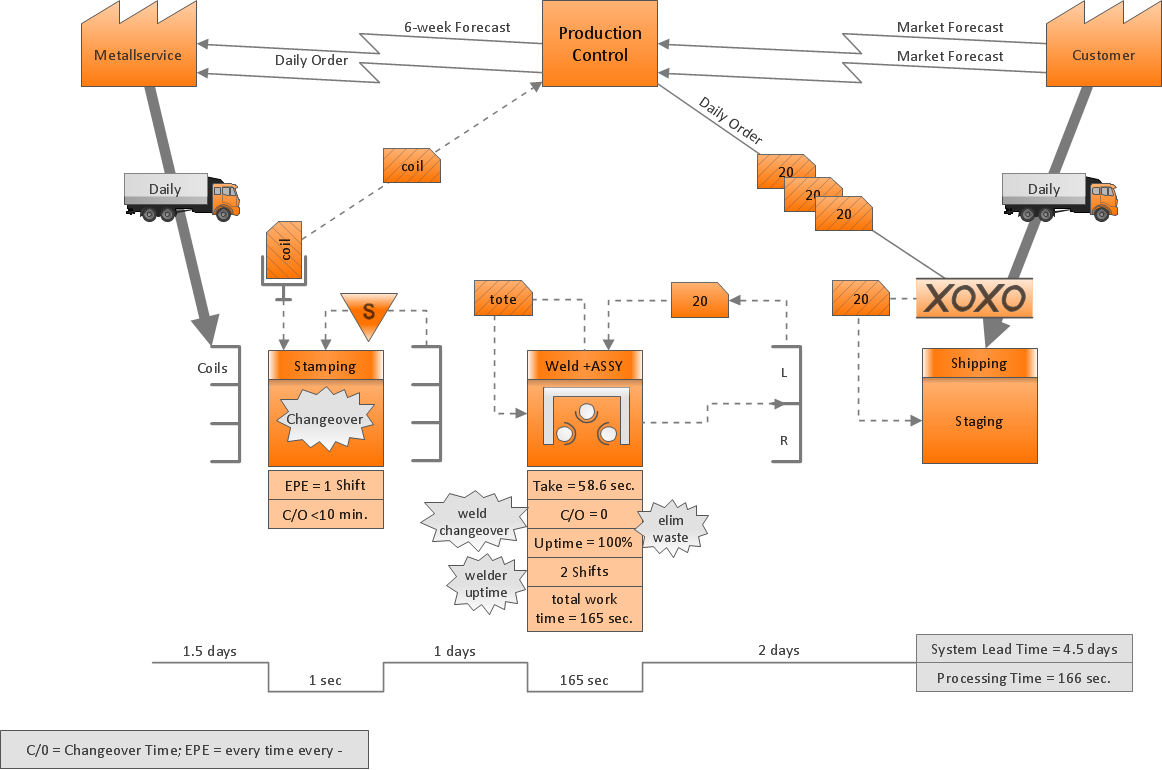
Picture: Value Stream Management
Related Solution:
Presentation tools. A convenient tool to present documents via Skype. Share your desktop, collaborate on documents in real-time and run a web conference one-on-one or one-to-many.
A tool for sharing and presenting business documents via Skype. Allows to present Microsoft® Word®, Microsoft PowerPoint®, Microsoft Project® and plenty mindmapping formats.
Picture: Presenting Documents with Skype
Related Solution:
Enterprise collaboration software helps to facilitate action-oriented teams working together over geographic distances by providing tools that aids on communication, collaboration process and problem solving.
Picture: How To Use Enterprise Collaboration Software
Related Solution:
To create flowcharts in MS Word, programs designed specifically for the purpose of creating flowcharts are particularly well-suited to the task.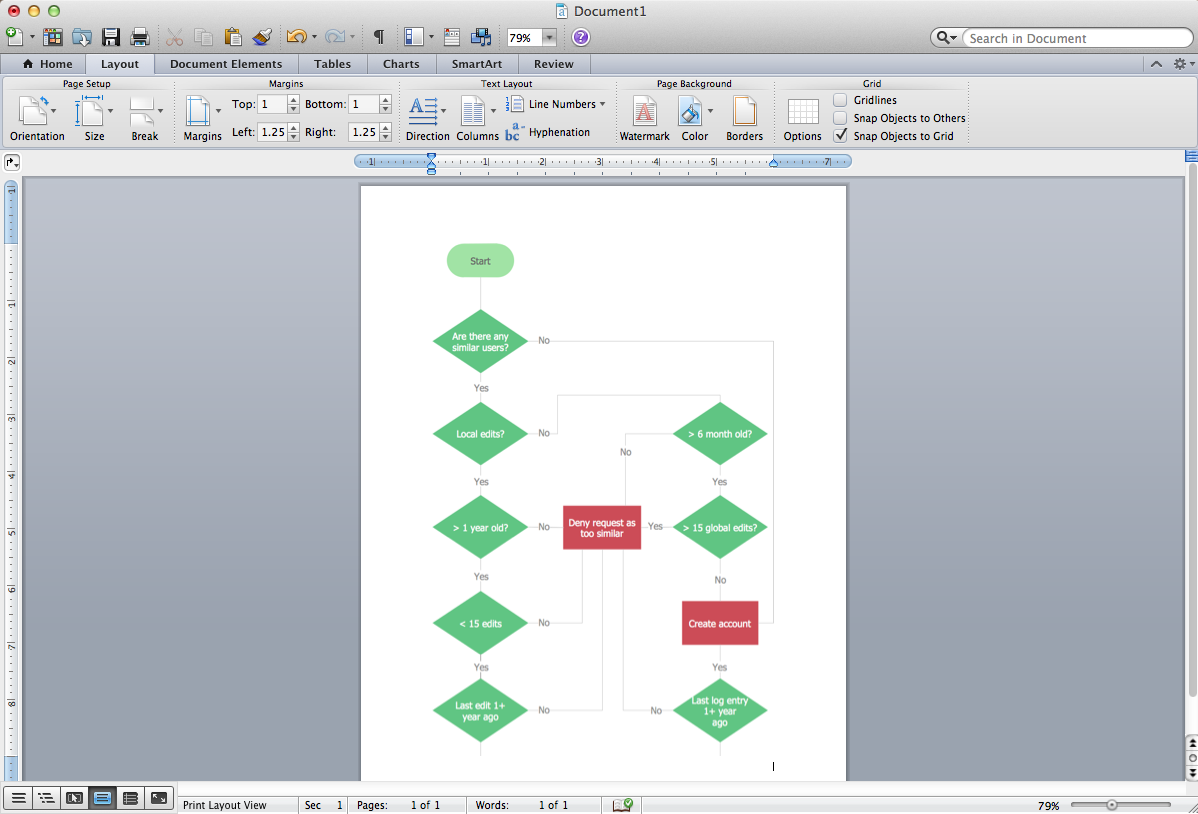
Picture: Flowcharts in Word
Related Solution:
Create bar charts for event management problem solving and visual data comparison using the ConceptDraw DIAGRAM diagramming and vector drawing software extended with the Bar Graphs Solution from the Graphs and Charts area of ConceptDraw Solition Park.
Picture: Bar Diagrams for Problem Solving.Create event management bar charts with Bar Graphs Solution
Related Solution:
Value Stream Map template helps you to create VSM diagrams using ConceptDraw DIAGRAM software.
Picture: How To create Value Stream Map (VSM)
Related Solution:
VSM →
Value stream mapping is a lean-management method for analyzing the current state and designing a future state for the series of events that take a product or service from its beginning through to the customer. ConceptDraw DIAGRAM diagramming and vector drawing software extended with Value Stream Mapping solution from the Quality area of ConceptDraw Solution Park is effective for implementation a value stream mapping (VSM) process and for creating Value Stream Maps.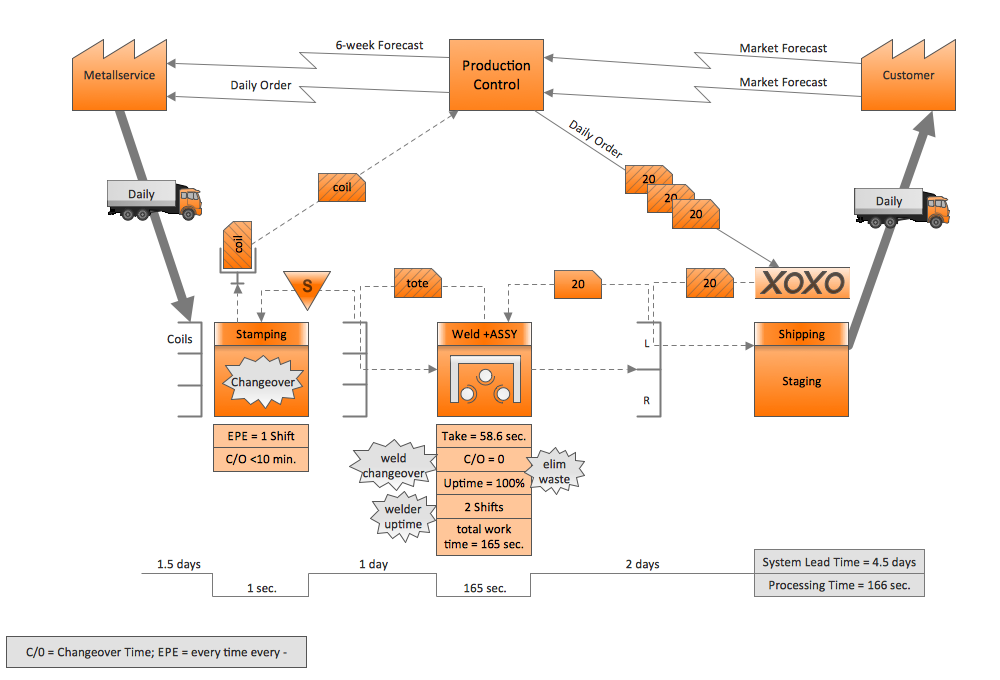
Picture: VSM
Related Solution:
ConceptDraw MINDMAP is a fundamental tool in quality management to describe visual instructions on any process.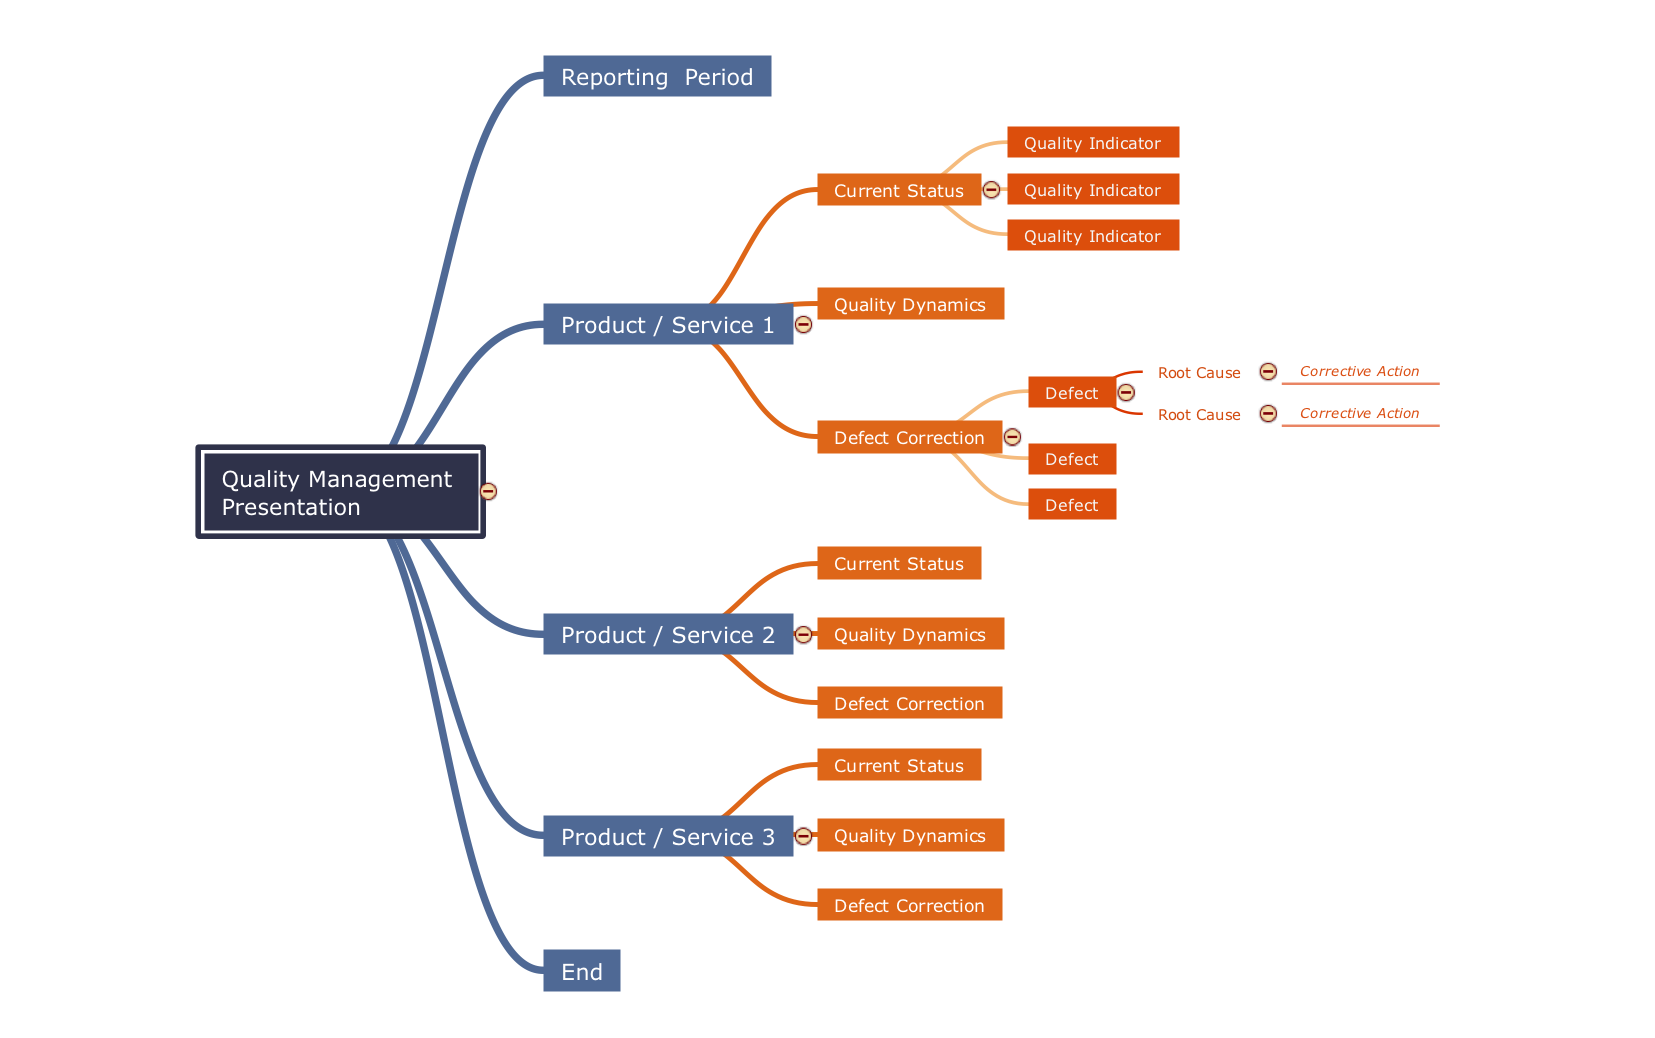
Picture: Fundamental Tool in Quality Management
Related Solution:
The Value stream is a totality of all actions on the projection, order composition and production: starting from creation a product project to launching this product, from order to delivery, from extraction of raw materials to ready product manufacturing. Value stream mapping is a process of visualization of these actions and creation of a detailed and graphical map.
Picture: Value stream with ConceptDraw DIAGRAM
Related Solution:
The new Value Stream Mapping solution found in the ConceptDraw Solution Park continues to extend the range of ConceptDraw DIAGRAM into a business graphics tool.
Picture: Value Stream Diagram
Related Solution:
ConceptDraw
MINDMAP 16