Successful Strategic Plan
This sample was created in ConceptDraw DIAGRAM diagramming and vector drawing software using the Management Solution from the Business Productivity area of ConceptDraw Solution Park.
This sample shows the Strategic Plan of the Broadband Lifecycle that was developed by Strategic Networks Group. The Broadband Lifecycle represents the advance of the broadband investments.
Pic.1 Successful Strategic Plan
Using the libraries of the Management Solution for ConceptDraw DIAGRAM you can create your own professional Strategy and Management Diagrams quick and easy.
All the diagrams produced with ConceptDraw DIAGRAM are vector graphic documents and are available for reviewing, modifying, and converting to a variety of formats (image, HTML, PDF file, MS PowerPoint Presentation, Adobe Flash or MS Visio).
TEN RELATED HOW TO's:
The SWOT Analysis solution from the Management area of ConceptDraw Solution Park contains set of examples, templates and vector design elements of SWOT and TOWS matrices. It helps you to quickly draw SWOT and TOWS analysis matrix diagrams using the best SWOT matrix software ConceptDraw DIAGRAM.
Picture: SWOT Matrix Software
Related Solution:
To create flowcharts in MS PowerPoint, programs designed specifically for the purpose of creating flowcharts are particularly well-suited to the task.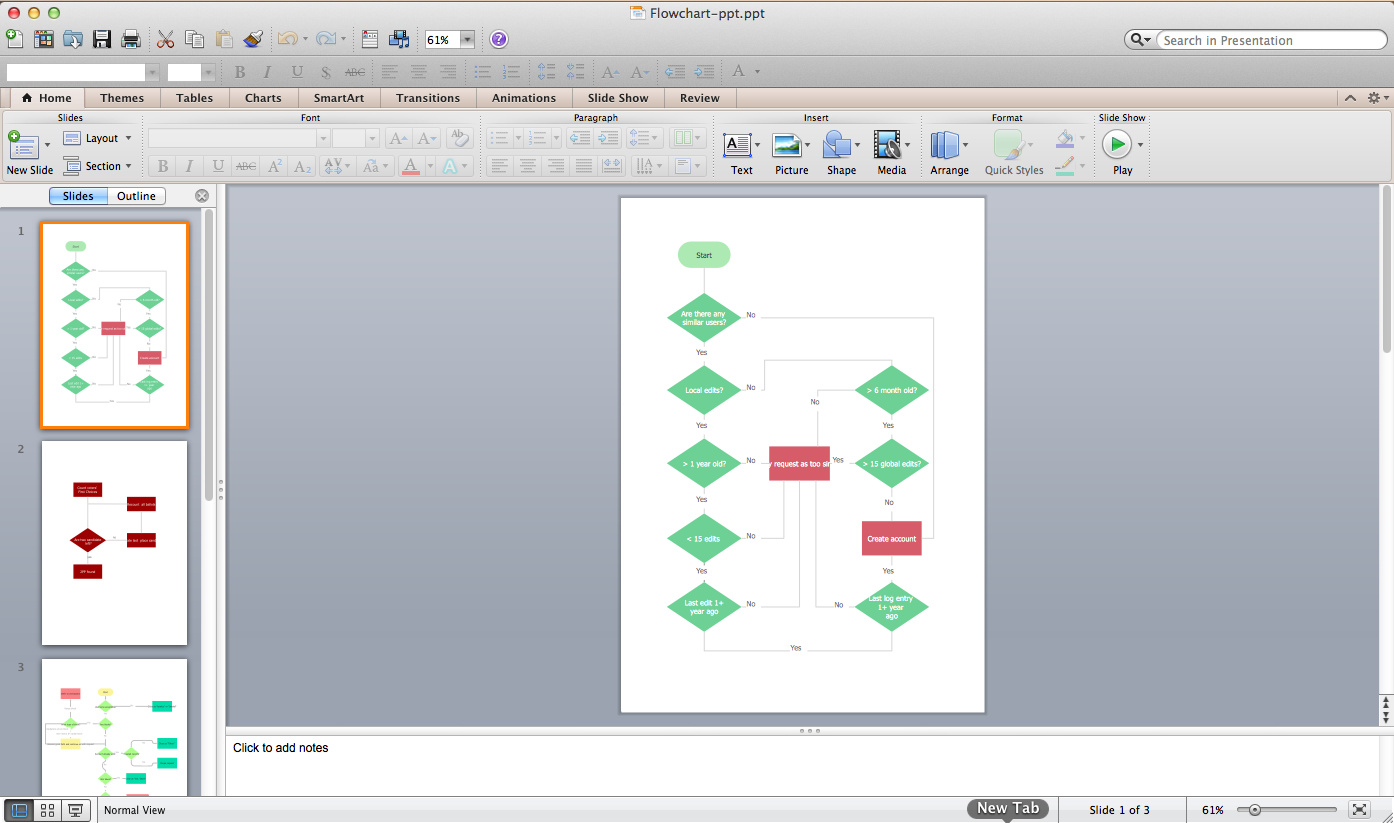
Picture: Flowcharts in PowerPoint
Related Solution:
ConceptDraw DIAGRAM is a business flowchart software includes the wide flowchart examples package.
Picture: Basic Flowchart Examples
Related Solution:
ConceptDraw PROJECT is simple project scheduling software delivering the full range of classic project reports about statuses and resorces usage. Learn how features of project gantt charts works in simple ConceptDraw PROJECT scheduling software, how to export project management dashboard in excel representation.
Picture: Gantt charts for planning and scheduling projects
Gant Chart is a graphical representation of tasks as segments on a time scale. It helps plan and monitor project development or resource allocation. The horizontal axis is a time scale, expressed either in absolute or relative time.
Picture: Gant Chart in Project Management
Related Solution:
This sample shows the Flowchart that displays the layout and work flow of the cloud marketing platform. This diagram has a style of the marketing brochure. This style displays the central product that is related to the other issues.
Using the ready-to-use predesigned objects, samples and templates from the Flowcharts Solution for ConceptDraw DIAGRAM you can create your own professional looking Flowchart Diagrams quick and easy.
Picture: Flowchart Marketing Process. Flowchart Examples
Related Solution:
If you have no time, you can create a SWOT diagram even on asphalt using a chalk. Although, in case you want a proper scheme, you should use a special software for creating SWOT analysis diagrams that would be comprehensible. SWOT analysis is useful not only for business purposes, but even for cities or for a particular person.
The ConceptDraw SWOT and TOWS Matrix Diagrams solution is a tool for performing both SWOT and TOWS analysis. It provides templates of different sorts of Matrix Diagrams. Besides different embedded templates, the solution enabling create custom SWOT and TOWS matrices. Using the compatibility between the MINDMAP and DIAGRAM is the best way of making SWOT or TOWS diagrams quickly. The mind map templates help identify the core statements of SWOT and TOWS analysis: Strengths, Weaknesses, Opportunities, and Threats. The next step is matrix creation - both SWOT and TOWS analysis use the same basic steps and the only difference is the order in which these criteria are studied.
Picture: Software for Creating SWOT Analysis Diagrams
Related Solution:
The SWOT Analysis solution contains easy-to-use mind map templates that help identify Strengths, Weaknesses, Opportunities, and Threats, as well as outputs to ConceptDraw DIAGRAM for presenting analysis results.
Picture: SWOT Analysis
Related Solution:
Long time you have looked for the convenient and helpful software for drawing HVAC Business Plan? Now ConceptDraw DIAGRAM diagramming and vector drawing software offers you the HVAC Plans Solution from the Building Plans Area that will help you create any desired HVAC Business Plan.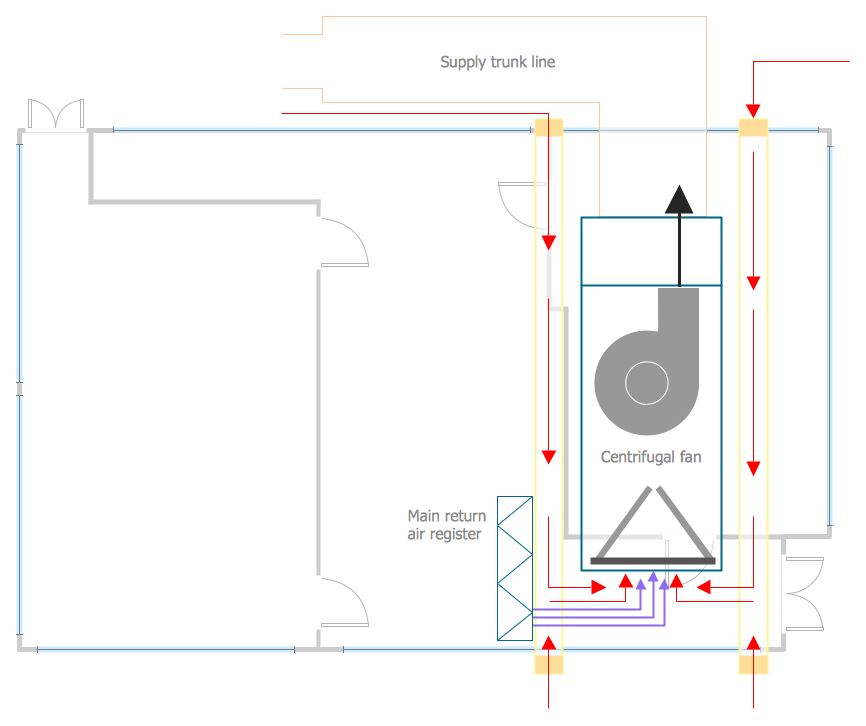
Picture: HVAC Business Plan
Related Solution:
For vector shapes and connector tools for quick and easy drawing diagrams for business, technology, science and education - The best choice for Diagramming is ConceptDraw DIAGRAM.
Picture: Diagram Software - The Best Choice for Diagramming
ConceptDraw
DIAGRAM 18