Computer Network.
Computer and Network Examples
A Computer Network is a telecommunication network that allows the networked computing devices to exchange the data using the network links. The most known computer network is the Internet.
The network links or connections between the nodes are set up using the cable media or wireless media. The nodes are the network computer devices, such as the computers, phones, servers.
There are many different types of the computer networks: Personal area network (PAN), Local area network (LAN), Metropolitan area network (MAN), Campus area network (CAN), Storage area network (SAN), Global Area Network (GAN) and Wide area network (WAN).
ConceptDraw DIAGRAM is a powerful computer network diagramming and vector drawing software. It provides the Computer and Networks Area for quick, easy and effective drawing the different types of computer network diagrams.
Solutions of the Computer and Networks Area contain many professional looking examples that you can customize for your needs to draw your own computer networks in a few minutes. You can also use the great number of ready-to-use predesigned vector objects from the libraries of the Computer and Networks Area.
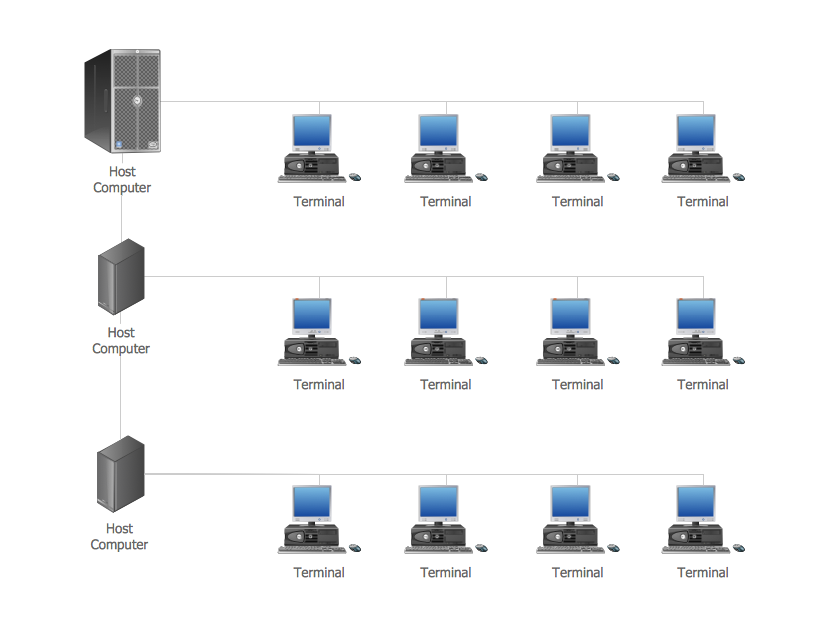
Example 1. Computer network.
This computer network example was created in ConceptDraw DIAGRAM using the Computer and Networks Area of ConceptDraw Solution Park.
The Computer Network Diagrams created with ConceptDraw DIAGRAM are vector graphic documents and are available for reviewing, modifying, and converting to a variety of formats (image, HTML, PDF file, MS PowerPoint Presentation, Adobe Flash or MS Visio).
See also Samples:
TEN RELATED HOW TO's:
Structured-systems analysis and design method uses data flow diagrams to represent the process of data flowing through a system. Talking about this might be useless without a proper example of DFD for online store (Data Flow Diagram). This DFD example shows all the distinctness that a diagram can bring into a scattered data structure.
Data flow diagrams are used to show how data is processed within some business processes. Making DFD is a common practice for business process modeling and analysis. This diagram represents the online store business flow. It describes inputs and outputs within online selling process and depicts the interactions between its participants. This DF diagram can be used by system analysts to create an overview of a business, to study and discover its inherent strengths and weak points.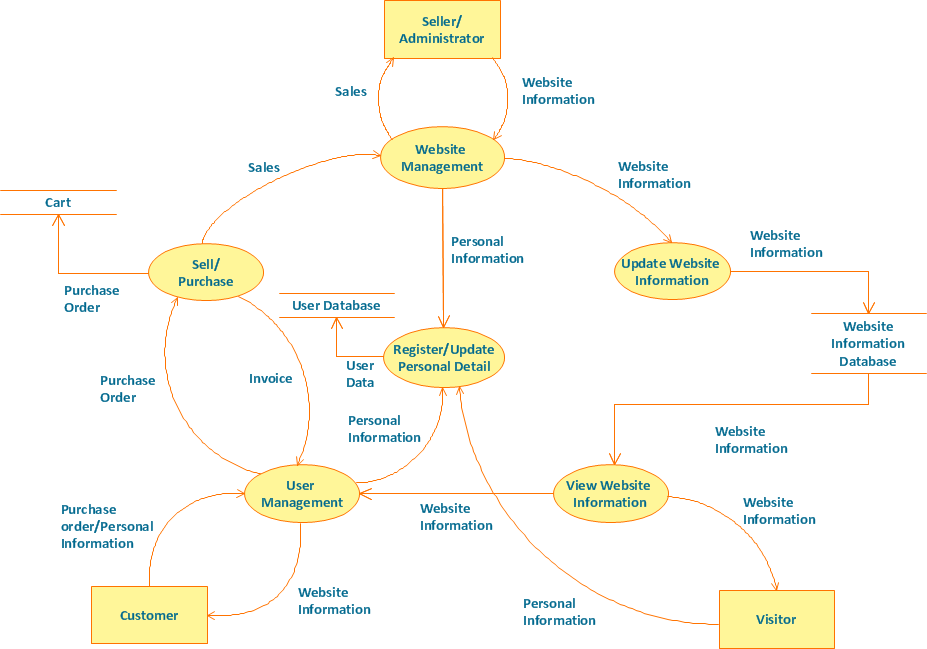
Picture: Example of DFD for Online Store (Data Flow Diagram)
Related Solution:
ConceptDraw DIAGRAM extended with Workflow Diagrams solution from the Business Processes area is an ideal software for professional drawing various types of workflow diagrams and charts, including Wide Area Work Flow diagrams of any complexity.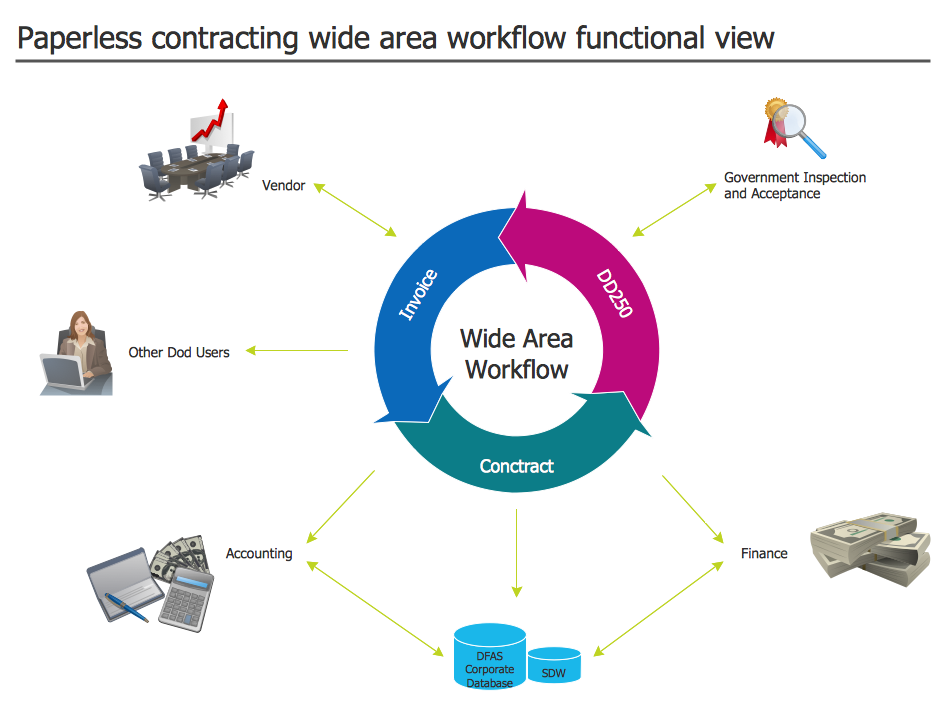
Picture: Wide Area Work Flow
Related Solution:
When designing a network, it is important to take into account the hierarchy of network devices. When you have a root device you should consider a tree network topology that might have any number of lower levels as you might need. This technology is based on star and bus network topologies.
This is a schematic representation of a Tree computer network topology. A tree topology means that some star networks are linked together. A star network is a topology of the local network where a central workstation is connected with each end-user computer or peripherals. A tree structure means that, the central nodes of these star networks are linked to a main cable (the Bus topology). So, a Tree network topology is a few Star networks connected into a Bus topology. This scheme can be applied to draw the particular physical or logical network diagrams using the ConceptDraw Computer and Networks solution.
Picture: Tree Network Topology Diagram
Related Solution:
Wireless network topology — logical topology.
Wireless network topology shows how the computers connect each other when there is no physical connection. The computers communicate each using the wireless devices.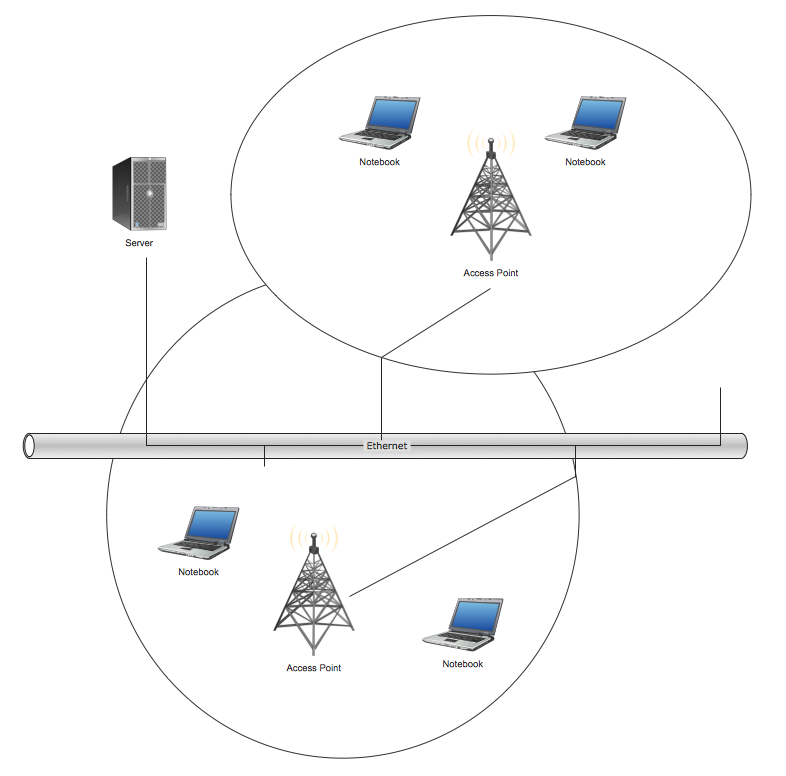
Picture: Wireless Network Topology
Related Solution:
Of course it is possible to keep network records in text documents, but it is very difficult to use them later. A more sound way to keep such documentation is to create a network diagram that might represent either logical network structure or physical. These diagrams are easy to understand and you will thank yourself later.
There is a physical network diagram. It is a tool to represent, maintain and analysis of network equipment and interconnections. Network diagram depicts the actual network information in the attractive clear graphic form. One can learn here the LAN cable length, telecommunication type and carrying capacity. The diagram depicts servers, IP address and domain name as well. Also it shows location of hubs, switches, modems, routers, and other network equipment. The sets of special symbols and images delivered with ConceptDraw Network Diagrams solution are used to show network components. Symbols have a standard view. Therefore, various specialists can read the network diagram without any discrepancies.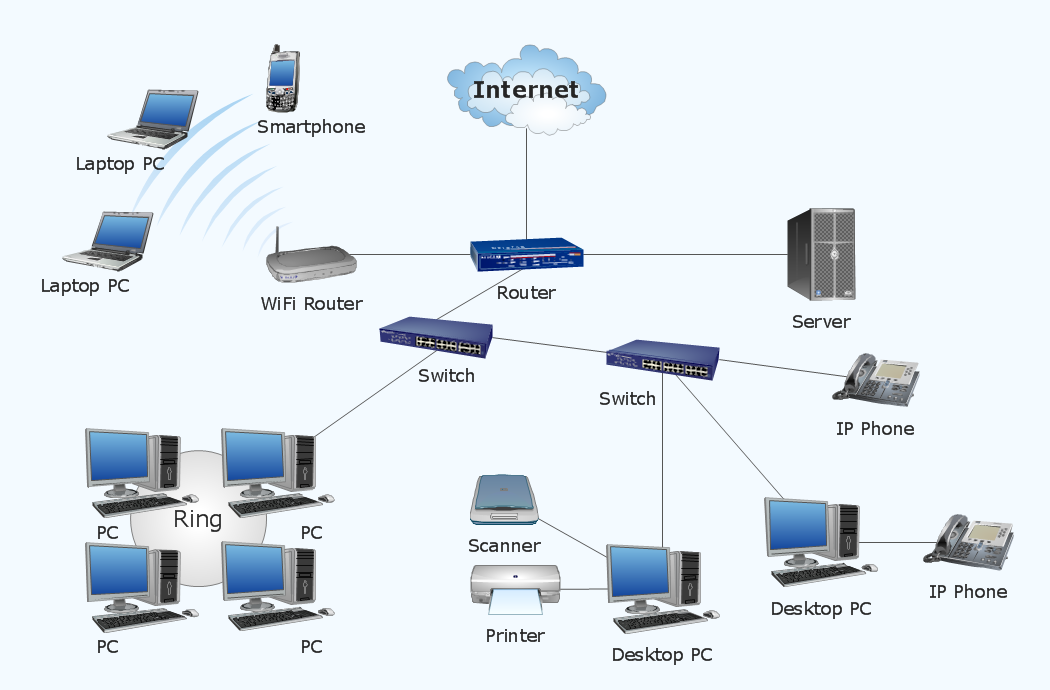
Picture: Network diagrams with ConceptDraw DIAGRAM
Related Solution:
This sample was created in ConceptDraw DIAGRAM diagramming and vector drawing software using the Computer and Networks solution from Computer and Networks area of ConceptDraw Solution Park.
This sample shows the Point-to-point network topology.
Network topology is the topological structure of the computer network.
Point-to-point network topology is a simple topology that displays the network of exactly two hosts (computers, servers, switches or routers) connected with a cable. Point-to-point topology is widely used in the computer networking and computer architecture.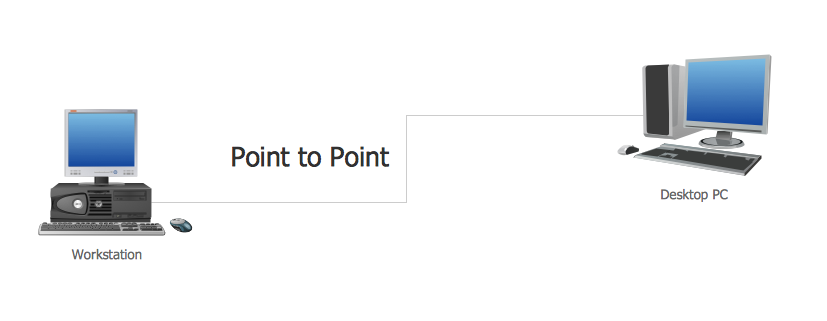
Picture: Point to Point Network Topology
Related Solution:
A database is a data collection, structured into some conceptual model. Two most common approaches of developing data models are UML diagrams and ER-model diagrams. There are several notations of entity-relationship diagram symbols and their meaning is slightly different. Crow’s Foot notation is quite descriptive and easy to understand, meanwhile, the Chen notation is great for conceptual modeling.
An entity relationship diagrams look very simple to a flowcharts. The main difference is the symbols provided by specific ERD notations. There are several models applied in entity-relationship diagrams: conceptual, logical and physical. Creating an entity relationship diagram requires using a specific notation. There are five main components of common ERD notations: Entities, Actions, Attributes, Cardinality and Connections. The two of notations most widely used for creating ERD are Chen notation and Crow foot notation. By the way, the Crow foot notation originates from the Chen notation - it is an adapted version of the Chen notation.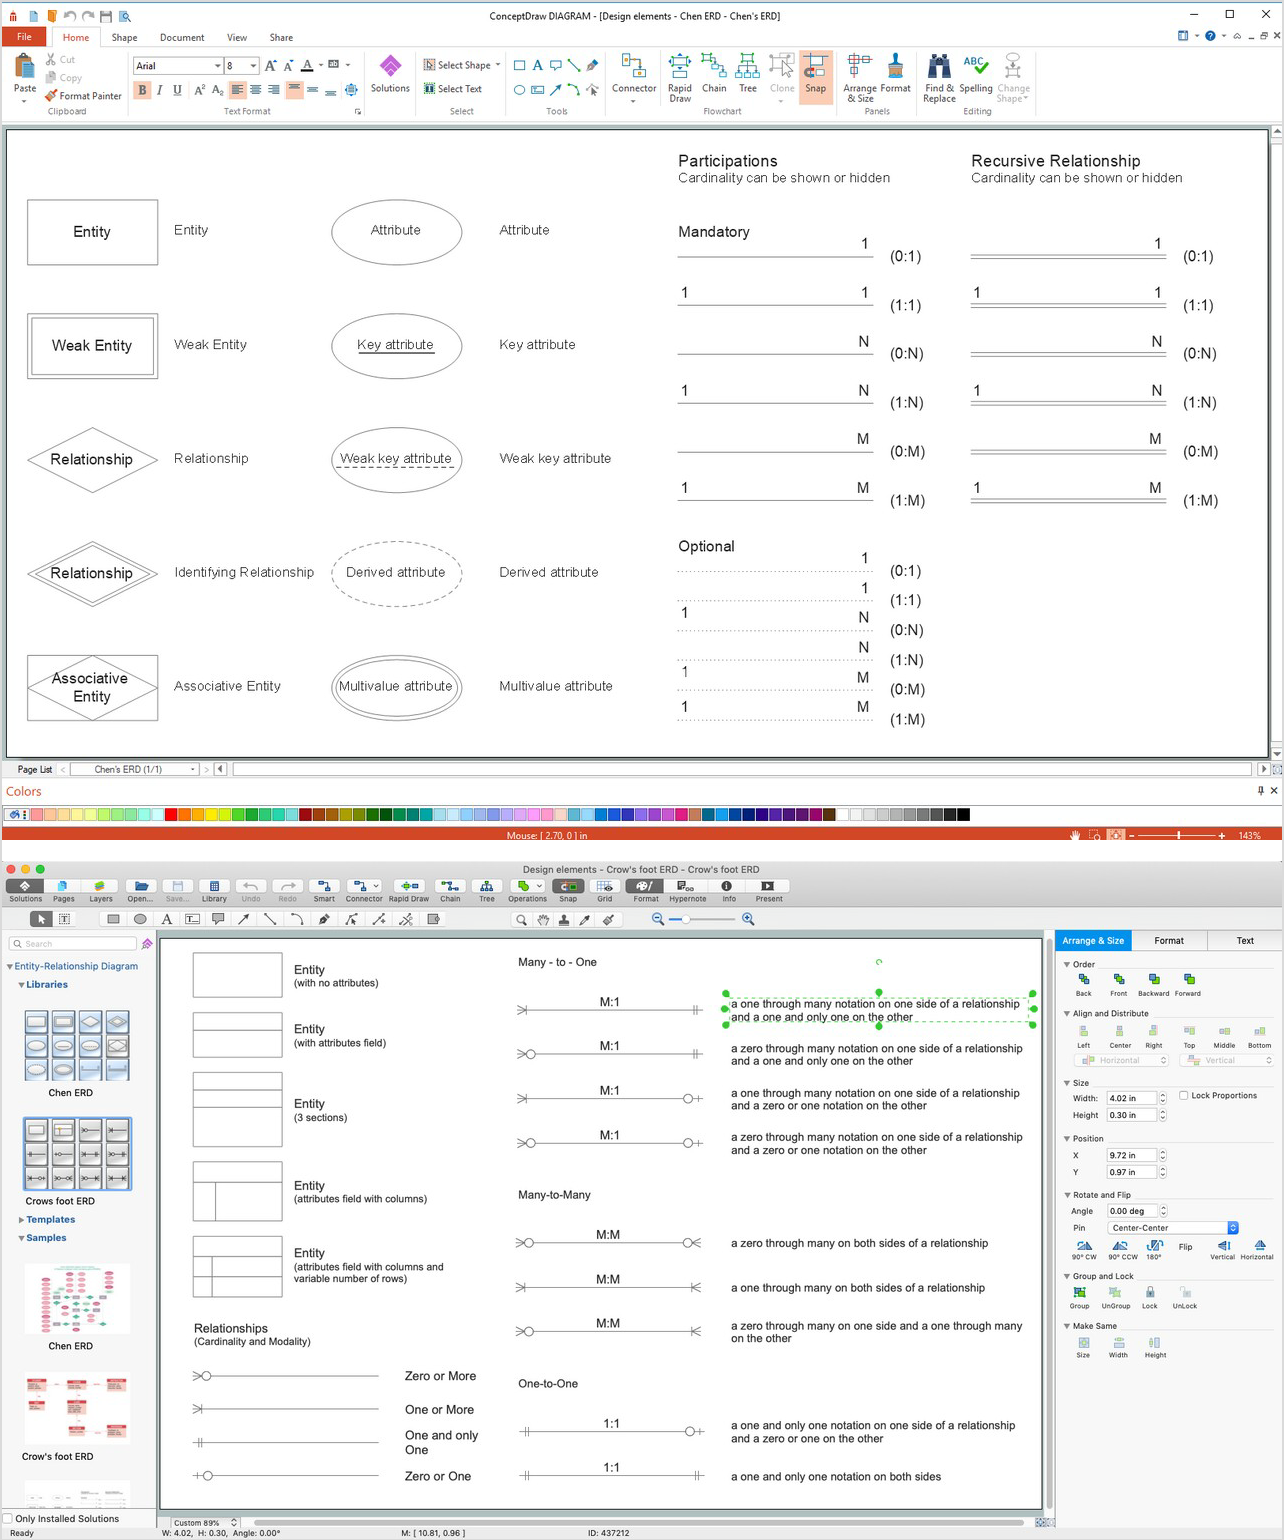
Picture: ERD Symbols and Meanings
Related Solution:
When describing any computer network, we imagine a set of devices and nodes, arranged in some way. Talking about network structures, we should distinguish physical and logical network topologies, as physical topology is about devices location and logical topology illustrates data flow. In the same time, they do not have to match, and some devices, such as repeaters, may have a physical star layout, but a bus logical topology.
There are two main types of computer network topologies: Physical topology that show the physical organization of a network - equipment and types of connections. Star network topology involves a set of devices that is connected to a single hub (router). Ring network topology means that, devices connected according this topology have two connections, connecting with nearby devices to make a loop. Bus network topology is the topology presented at the current diagram. It is similar to a ring topology. The difference is that data moves up and down a linear connection, copying itself where network equipment works as bus-stations along the way. This network topology can be used for small network, or when adding an extra device into a network.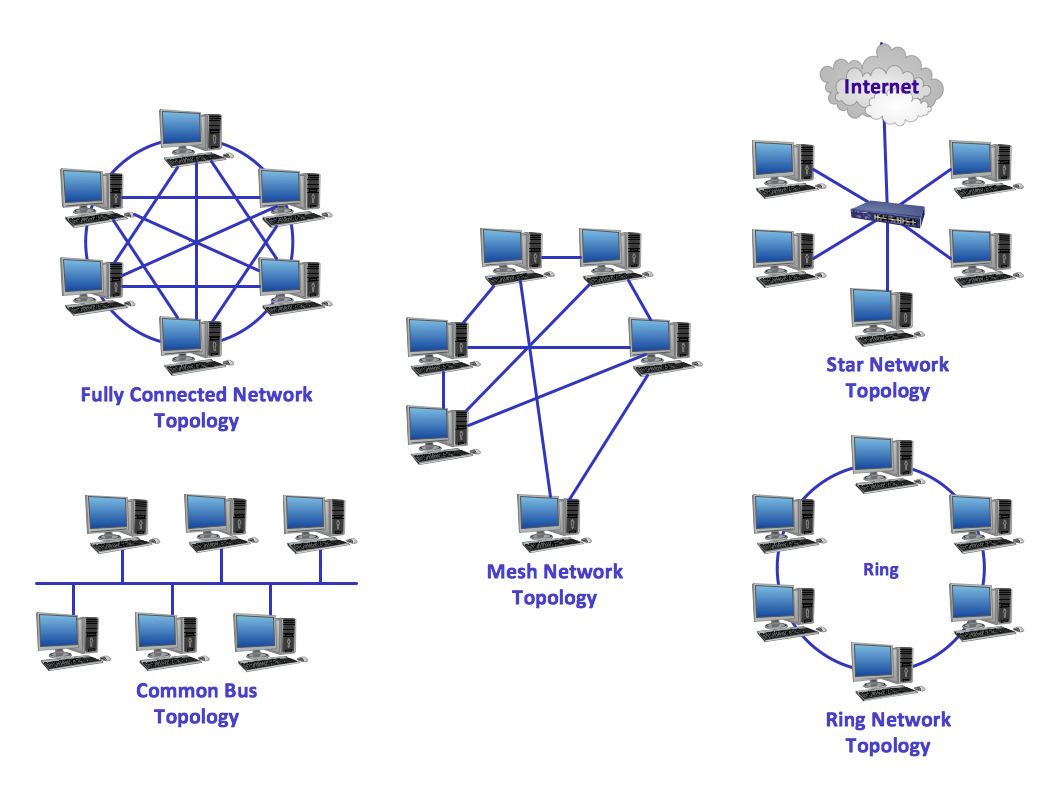
Picture: Network Topologies
Related Solution:
All computer networks differ by various params, and their size is one of them. As global area networks are the biggest, personal area (PAN) networks are the smallest. Personal computers, smartphones and other devices that have possibility to connect to Internet form a personal network.
This diagram was created using ConceptDraw Computer Network Diagrams to represent a typical components of Personal area network. A personal area network (PAN) is the connection of IT devices around an individual person. This sample of personal area network involves a notebook, a personal digital assistant (PDA), and a portable printer. Commonly a PAN contains such wireless devices as mouse, keyboard, smartphone and tablet. A wireless connection is typical for a PAN.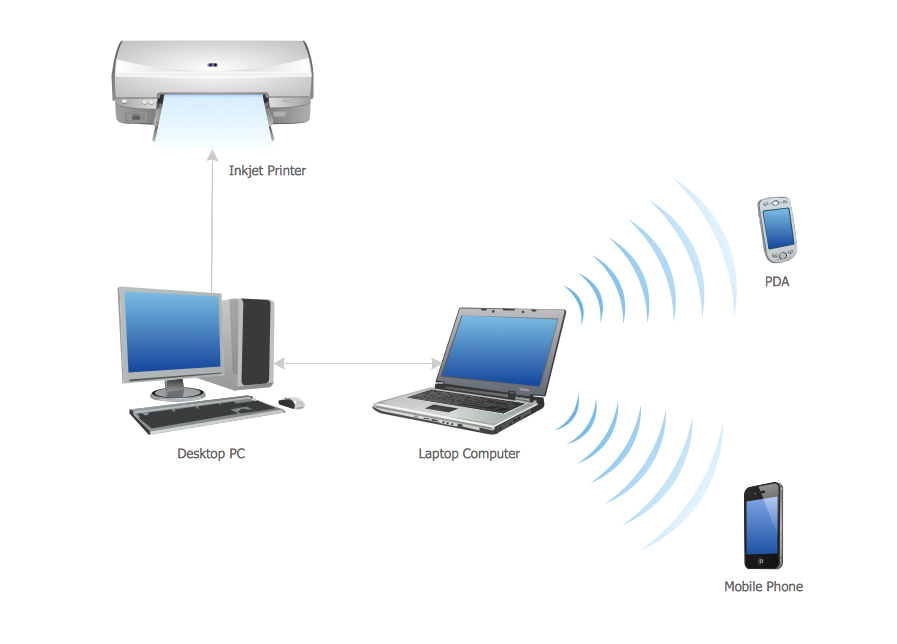
Picture: Personal area (PAN) networks. Computer and Network Examples
Related Solution:
A Wireless network is a type of the computer network that uses the wireless connections for connecting network nodes for data transfer. The wireless networks are very useful, inexpensive, popular and widely used. They are easy setup and do not require the cables installation.
Using the solutions of the Computer and Networks Area for ConceptDraw DIAGRAM you can design the wireless network diagrams of any complexity quick and easy.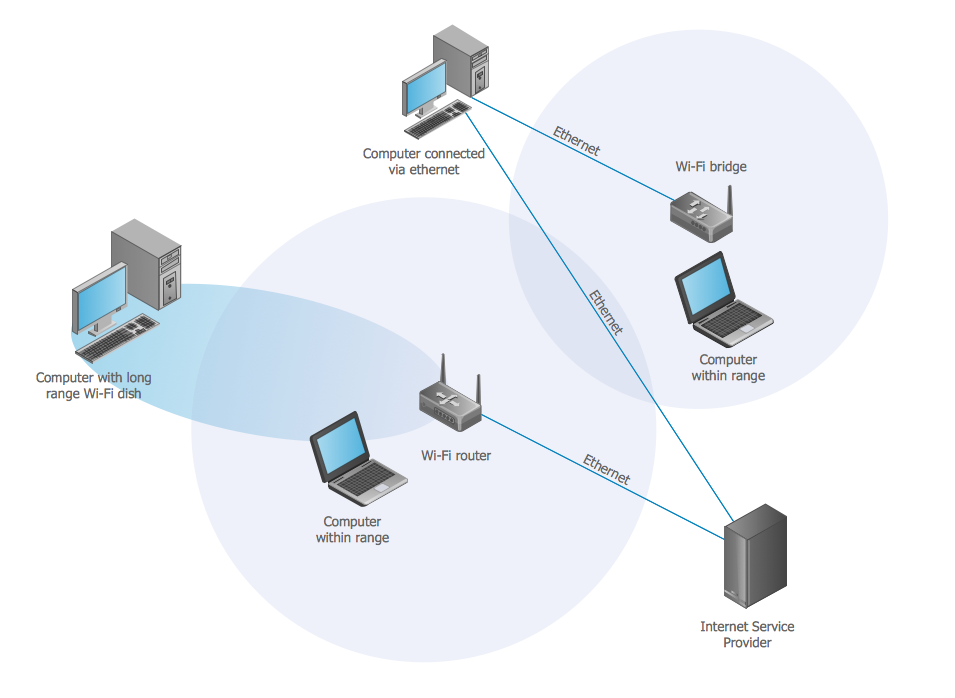
Picture: Wireless network. Computer and Network Examples
Related Solution: