Example 2. Home Area Networks (HAN)
This example was redesigned from the file [https://commons.wikimedia.org]
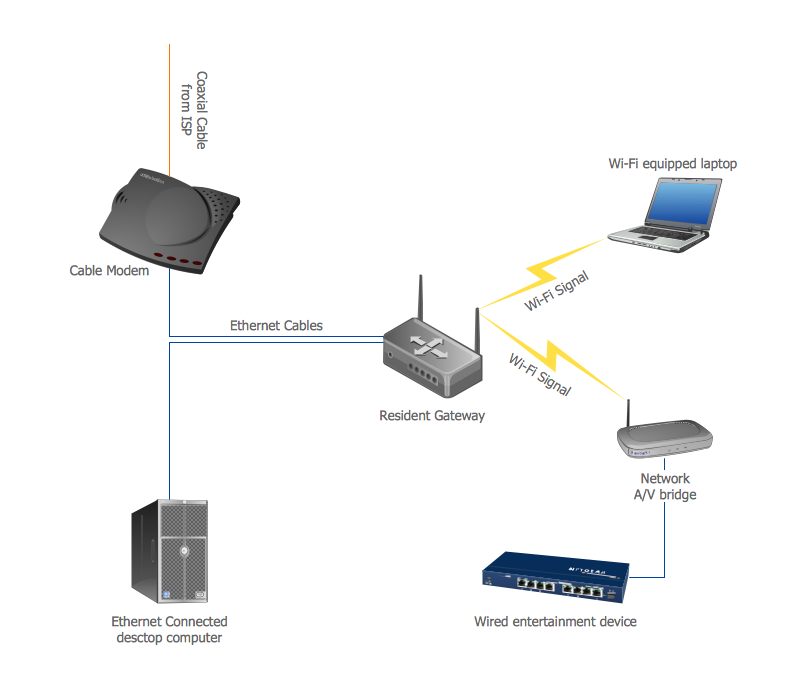
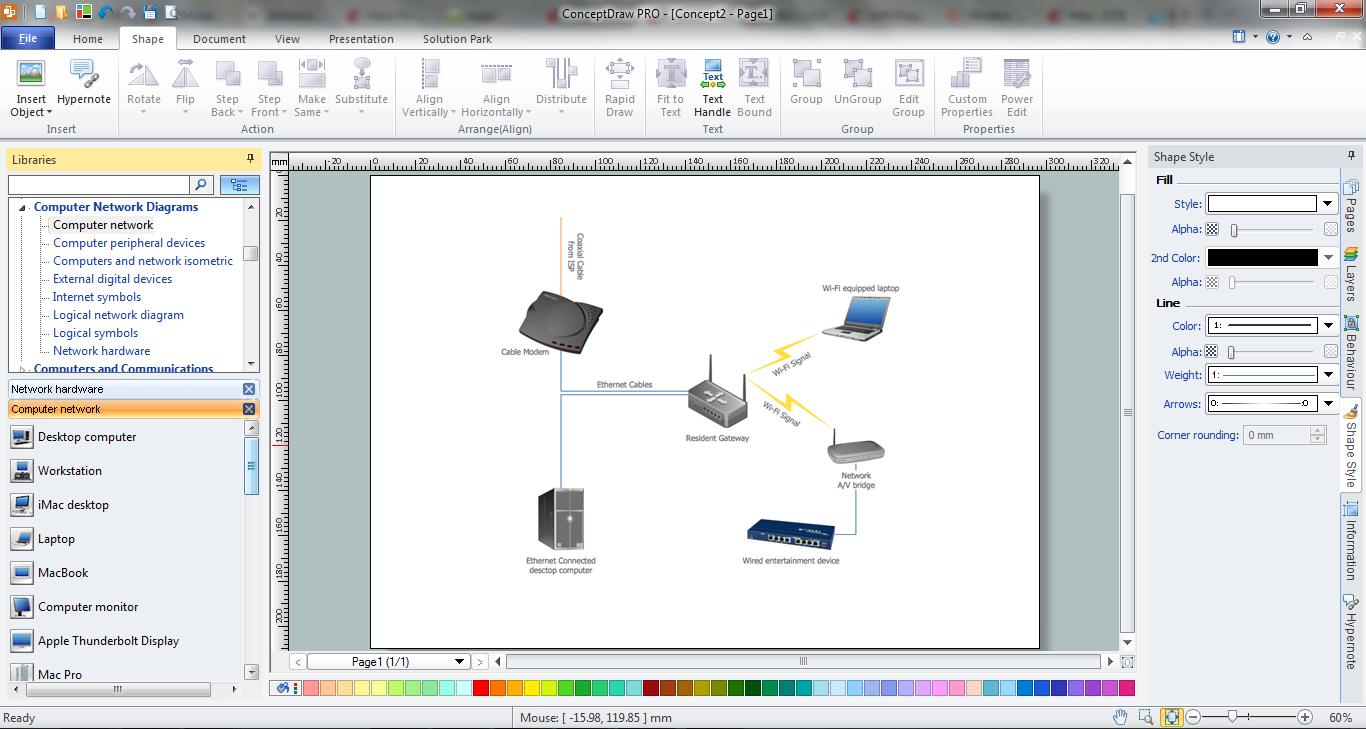
This example was created in ConceptDraw DIAGRAM using the predesigned objects from the libraries of Computer Network Diagrams Solution from the Computer and Networks Area and shows the home network diagram. An experienced user spent 5 minutes creating this sample.
The Home Area Networks (HAN) designed with ConceptDraw DIAGRAM are vector graphic documents and are available for reviewing, modifying, and converting to a variety of formats (image, HTML, PDF file, MS PowerPoint Presentation, Adobe Flash or MS Visio).
NINE RELATED HOW TO's:
Laos, officially the Lao People's Democratic Republic, is a landlocked country in Southeast Asia, bordered by Burma and China to the northwest, Vietnam to the east, Cambodia to the south, and Thailand to the west.
The vector stencils library Laos contains contours for ConceptDraw DIAGRAM diagramming and vector drawing software. This library is contained in the Continent Maps solution from Maps area of ConceptDraw Solution Park.
Picture: Geo Map - Asia - Laos
Related Solution:
The Internet is a giant computer network which connects computers all over the world. It is integral part of human society and business. But the serious question for network engineers, designers, lawmakers and enforcers is the need for protect the Internet networks from the Internet crimes, hacking and attacks. There are quite a number of hardware, software and physical methods of protection against them.
The samples you see on this page were created in ConceptDraw DIAGRAM using the tools of Network Security Diagrams Solution for ConceptDraw DIAGRAM software. They show protection networks with Firewalls and other network security devices.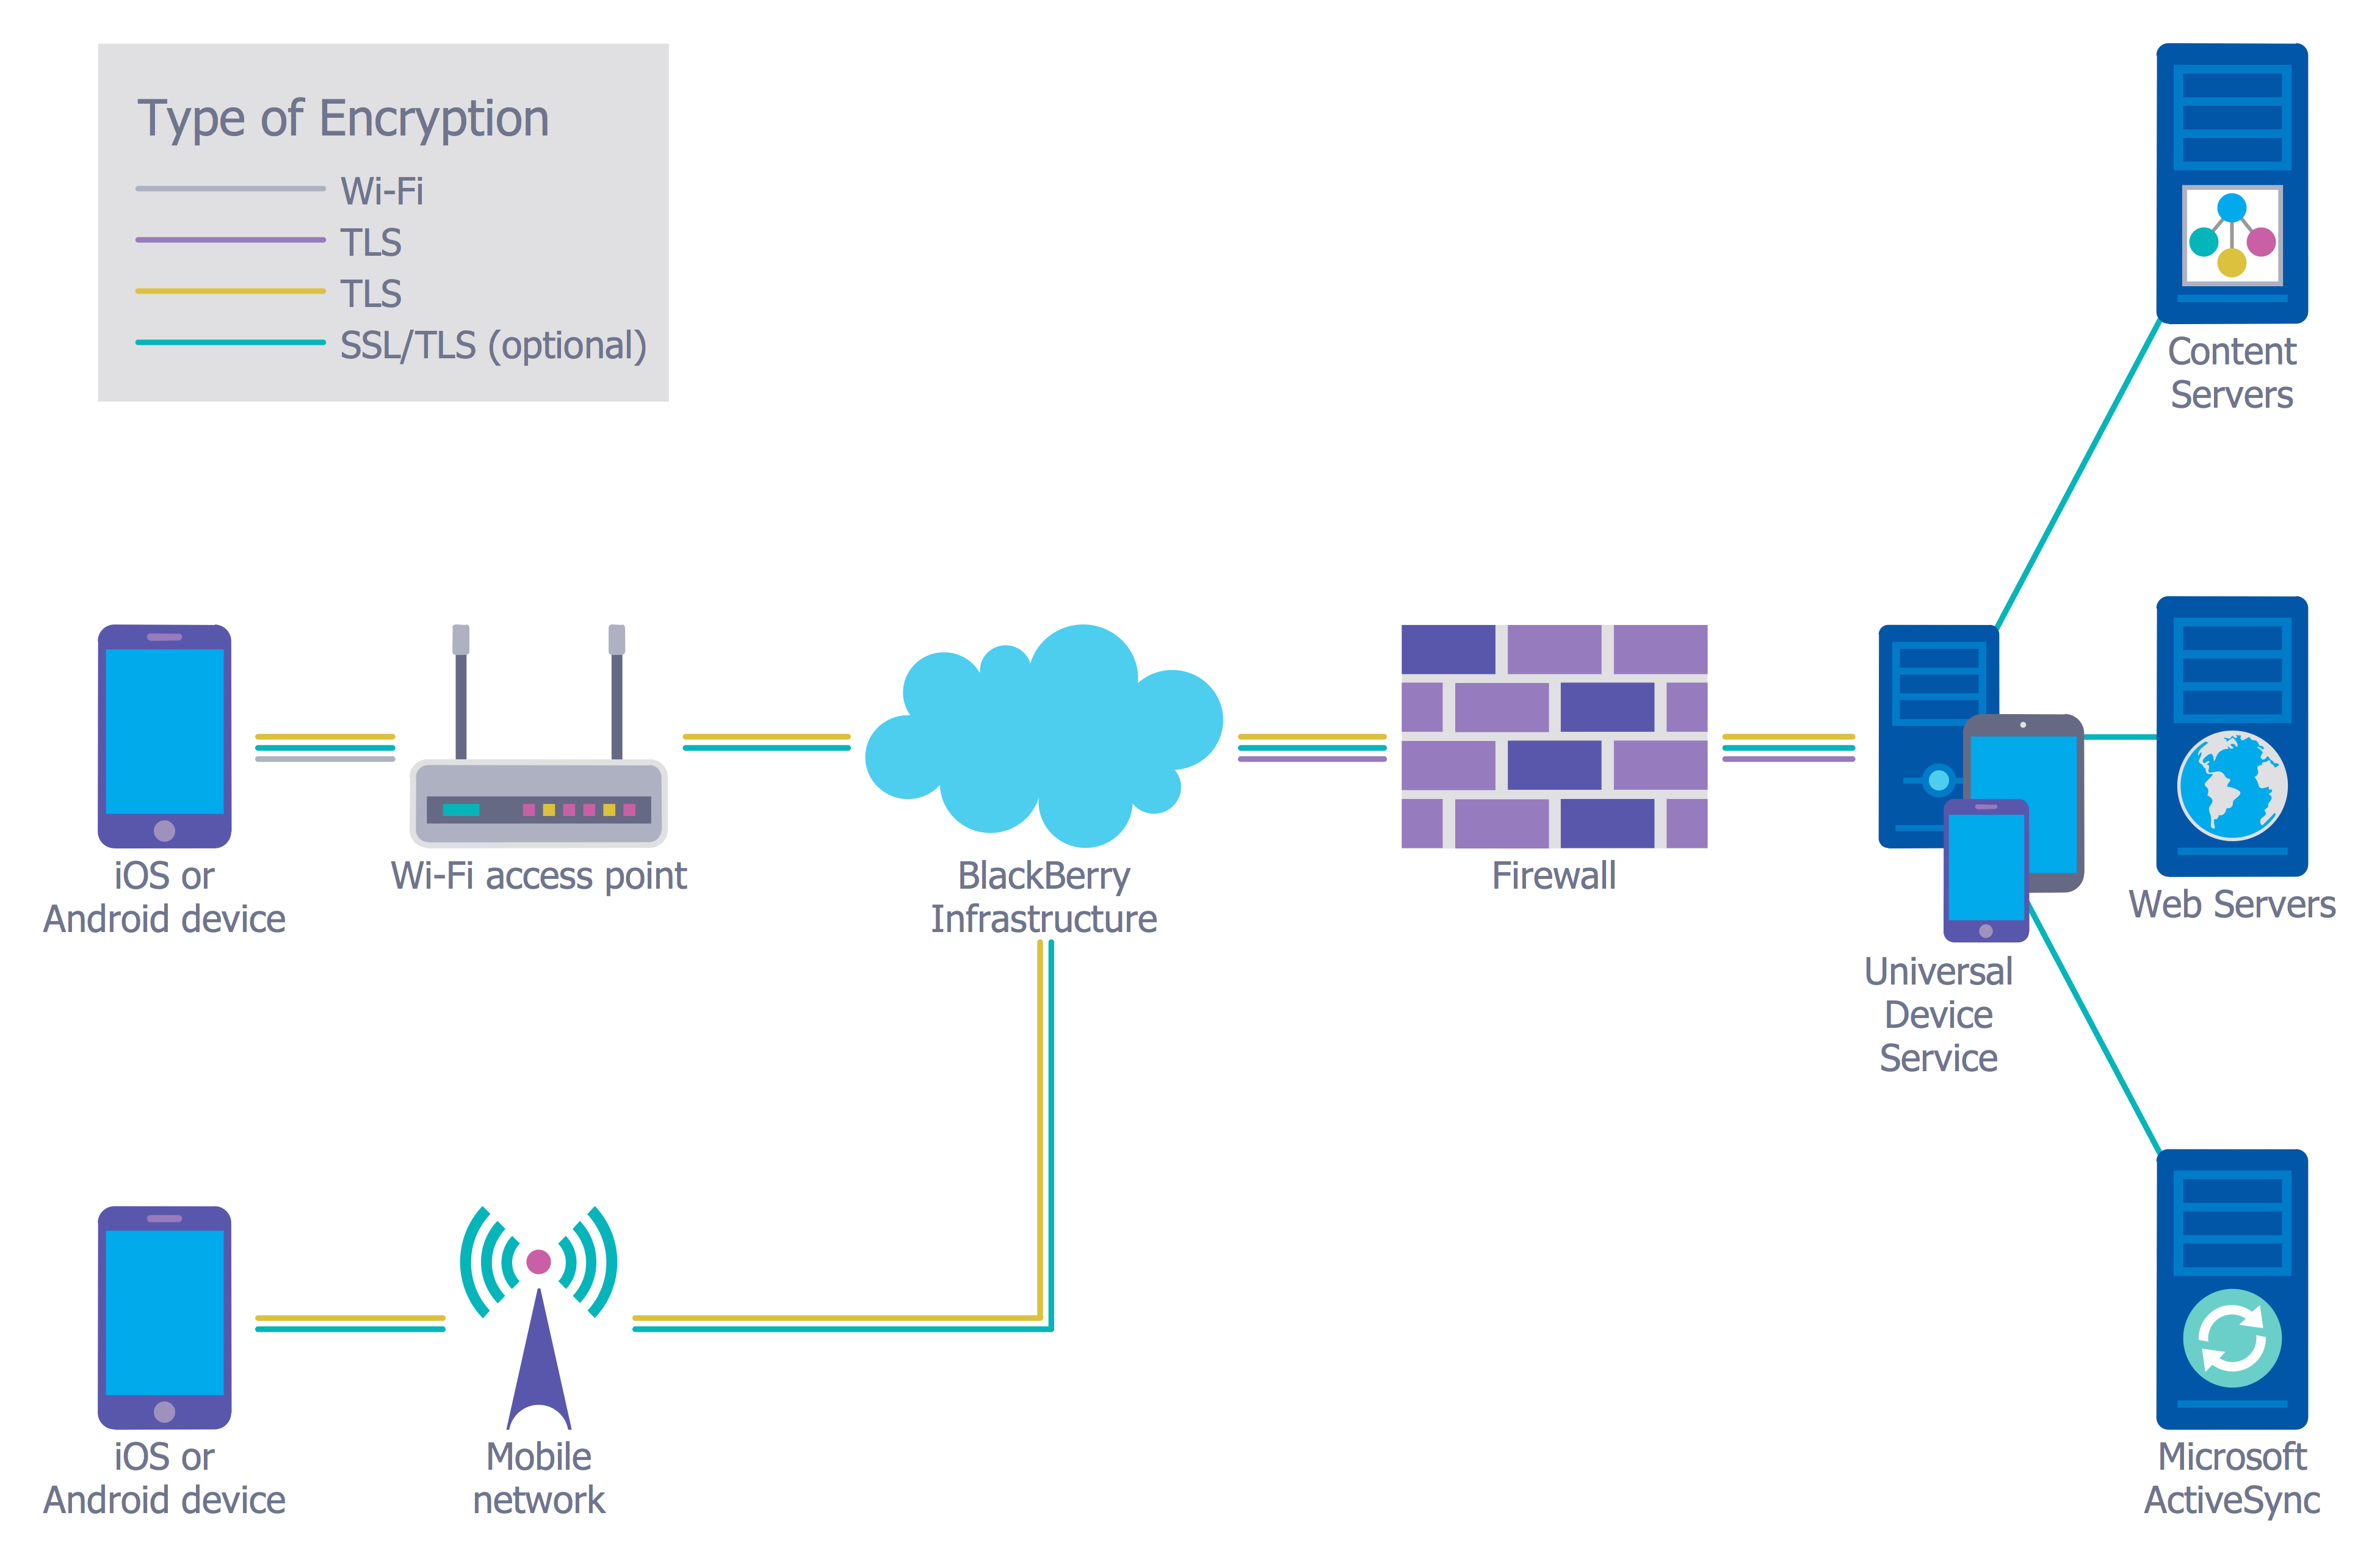
Picture: Network Security
Related Solution:
The CCTV is the process that carried out using the video cameras for transmitting the signal to the specific location, on the limited set of monitors. We are talking about the video cameras that are used for monitoring on such guarded objects as airports, banks, stores, military objects, etc. CCTV equipment is also used in the industrial installations, for surveillance in the public places, for recording the video on the digital video recorders.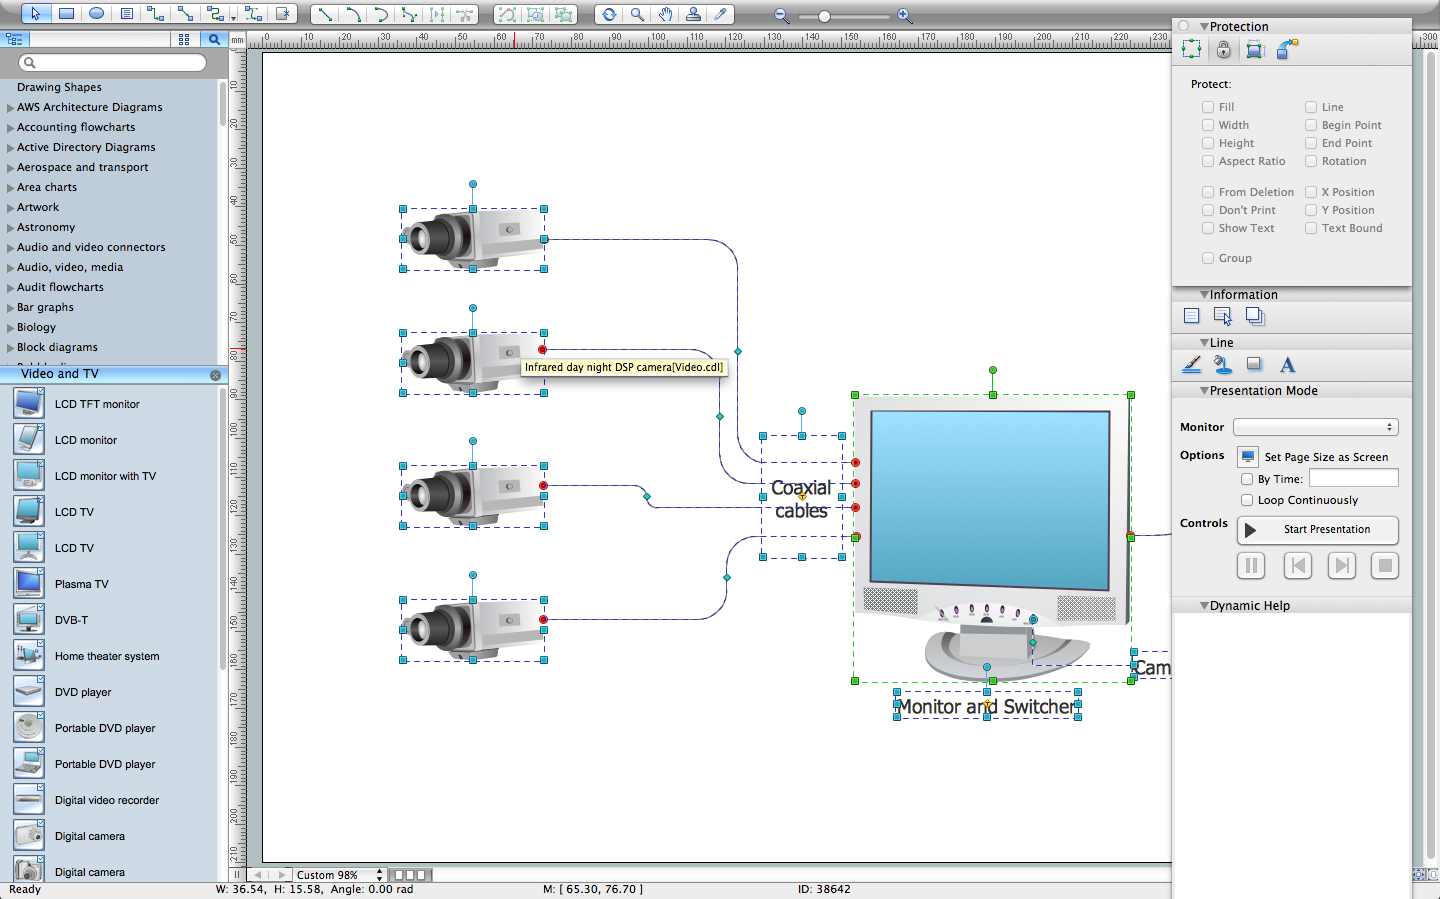
Picture: CCTV Network Diagram Software
Related Solutions:
Once you have created your document in ConceptDraw DIAGRAM and you want to share it with your colleagues and friends, who uses MS Visio on their computers, you can easily export your document using ConceptDraw DIAGRAM export to Visio XML files (VDX) feature.
Now you can share your ConceptDraw documents with MS Visio users.
Picture: Export from ConceptDraw DIAGRAM Document to MS Visio® XML
Architectural drawing allows to show the location of a building or ensemble of buildings on the ground, indicating the cardinal points. For centuries, people had been studying architecture in universities to learn how to draw building plans and now everyone can do it easily just using appropriate software. While developing the building plan, its graphic part, you can display the part of the floor or the entire floor of a building with an indication of the exact location of the drawn premise.
Small-sized apartments does not restrict the advanced interior design opportunities. Here is a detailed and precise floor plan of a pretty small apartment. A furniture objects are added to show possible interior of this home. This plan can be used to help somebody with a floor layout and furniture arrangement. Having this floor plan in a pocket while shopping would be useful to check if there is enough rooms for a new furniture.
Picture: How To Draw Building Plans
Related Solution:
The digital communication is a physical transfer of the data over a point-to-point or point-to-multipoint communication channel. Channels can be copper wires, optical fibres, wireless communication channels, etc. The data are realized as electromagnetic signals (radiowave, microwave, electrical voltage, etc.).
This example was created in ConceptDraw DIAGRAM using the Computer and Networks Area of ConceptDraw Solution Park and shows the Digital Communication Network diagram.
Picture: Digital Communications Network. Computer and Network Examples
Related Solution:
Unfortunately, a man can’t predict the future and no one is safe from natural disasters, such as floods, earthquakes, hurricanes or fires. Nonetheless, what you can do to ensure safety for you and your relatives is to create an emergency plan, so everyone will know what to do if emergency happens. Keep that plan simple and train it several times a year so that no one could forget any details of it.
Fire and emergency plans are important to supply people with a visual safety solution. This diagram presents a set of standard symbols used to depict fire safety, emergency, and associated information. Using clear and standard symbols on fire emergency plans provides the coherence of collective actions , helps to avoid embarrassment, and improves communications in an emergent situation. The fire emergency symbols are intended for the general emergency and fire service, as well as for building plans ,engineering drawings and insurance diagrams. They can be used during fire extinguishing and evacuation operations, as well as trainings. It includes vector symbols for emergency management mapping, emergency evacuation diagrams and plans.
Picture: Emergency Plan
Related Solution:
ConceptDraw DIAGRAM enhanced with Audio, Video, Media solution is a helpful tool for illustration of a CCTV network. It contains library of vector cliparts of video and TV devices and different digital gadgets for drawing such illustrations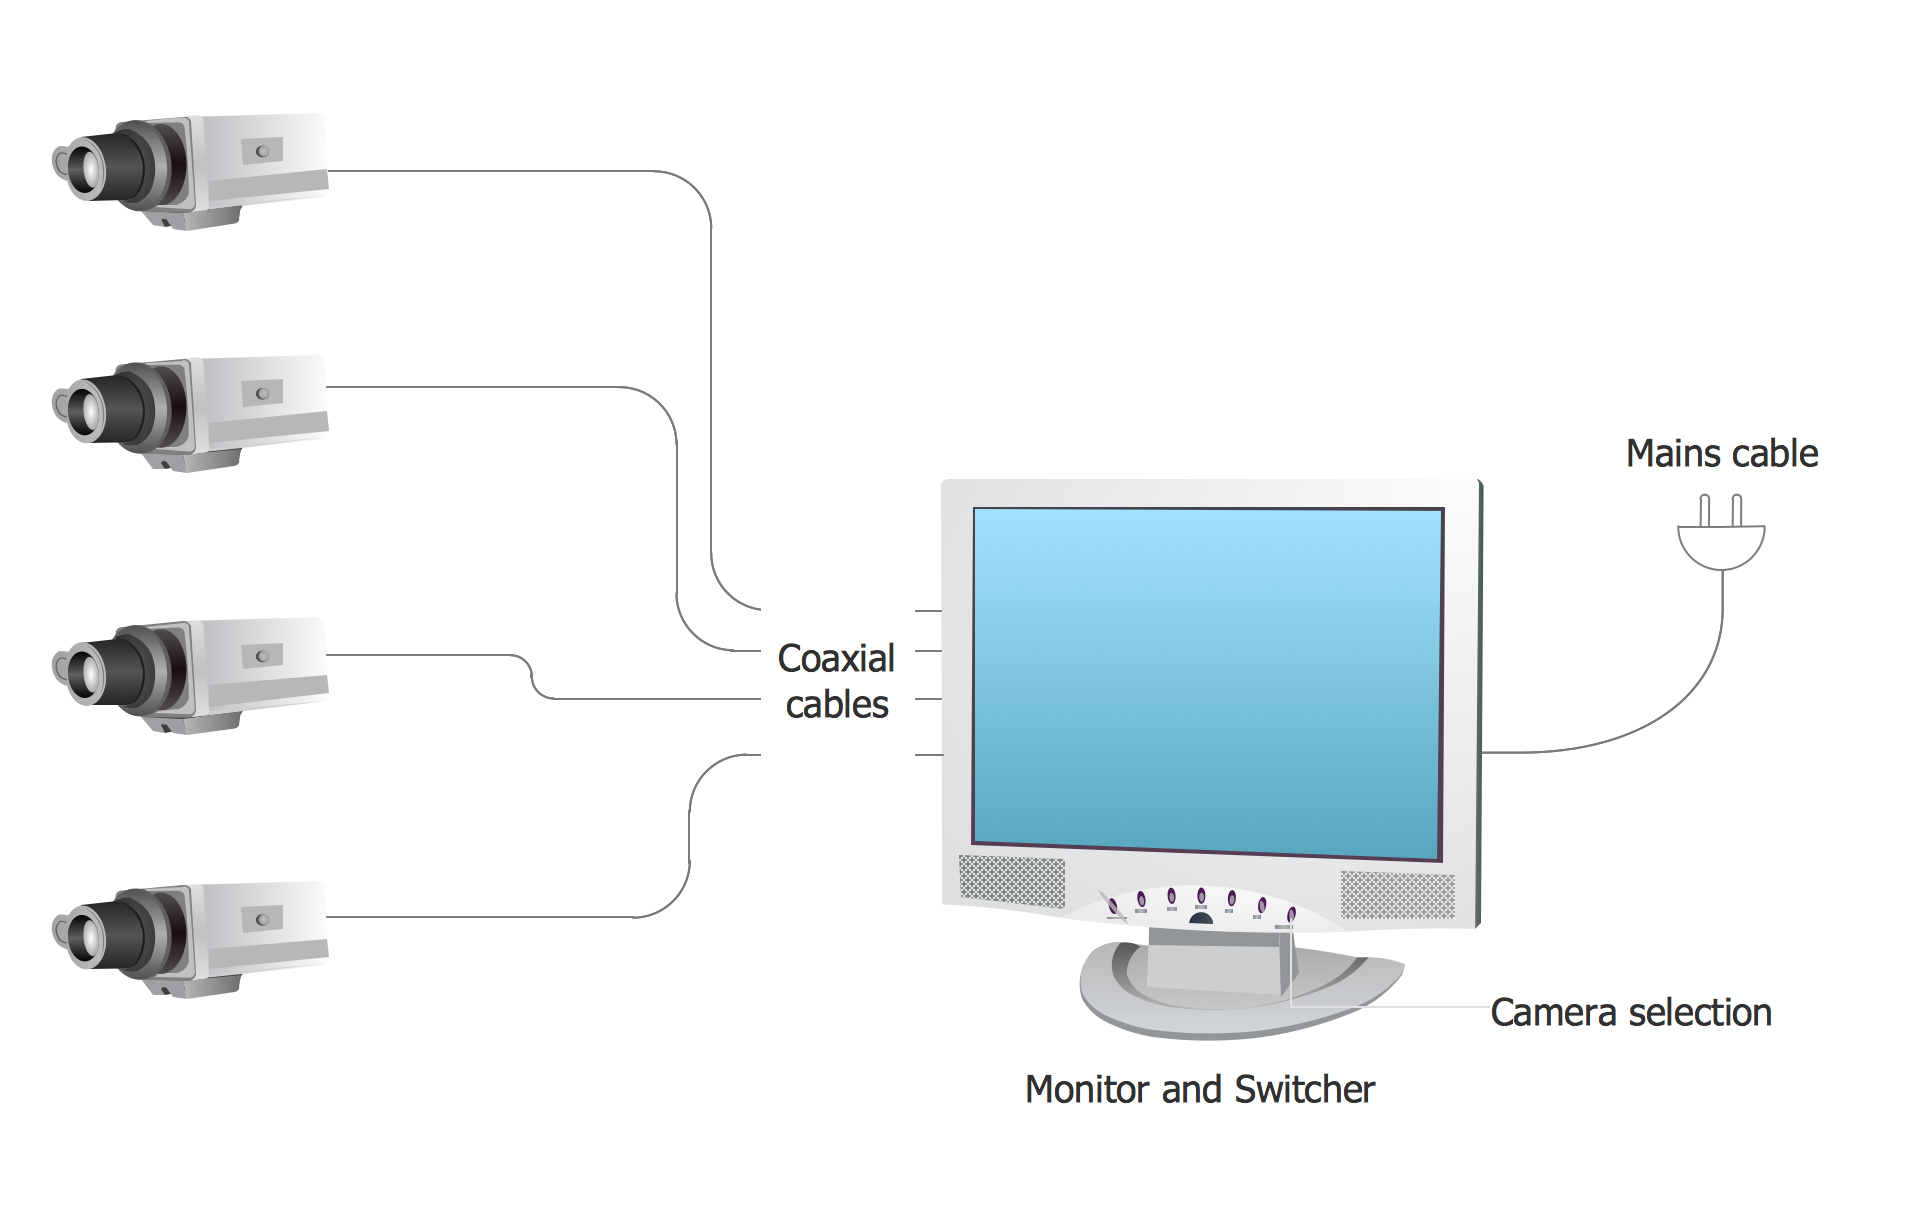
Picture: Basic CCTV System Diagram. CCTV Network Diagram Example
Related Solutions:
The Building Plans are very useful and even necessary for architects, builders, designers and simple for those who want to build the home, office, flat or anyone other building. They are also convenient for those who want to design or redesign the home, flat, room, etc.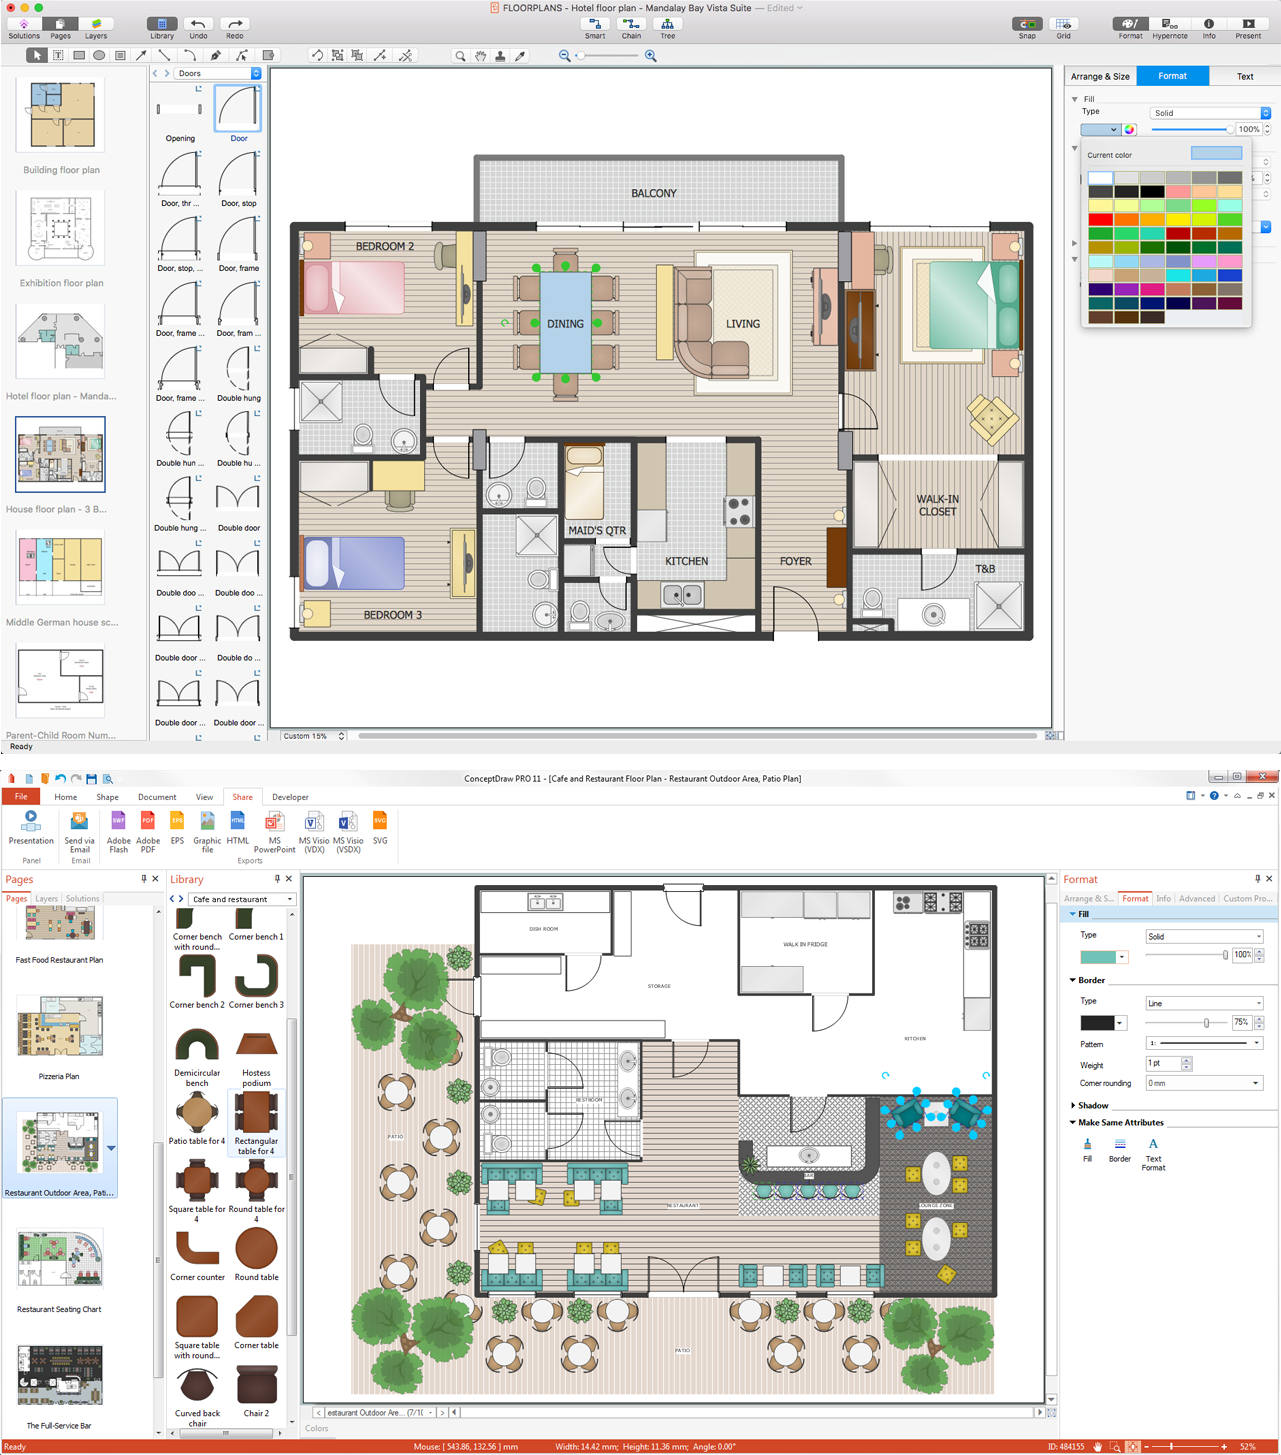
Picture: Building Plan Software. Building Plan Examples
Related Solution: