Draw Network Diagram based on Templates and Examples
How to use Network Diagram Templates
ConceptDraw has many network diagram templates:
However for customizing network diagrams you can use 10+ Libraries of the more than 2 000 pre-designed network elements.
 This network diagram template is created using ConceptDraw DIAGRAM diagramming and vector drawing software enhanced with Computer & Networks solution from ConceptDraw Solution Park.
Computer & Networks solution provides templates and examples of network architecture, topology and design diagrams, and libraries of symbols for network components.
Use templates and examples from Computer & Networks solution to draw professional-looking network diagrams quickly and easily, and to clearly present and communicate it to IT and telecom engineers, stakeholders and end-users.
This network diagram template is created using ConceptDraw DIAGRAM diagramming and vector drawing software enhanced with Computer & Networks solution from ConceptDraw Solution Park.
Computer & Networks solution provides templates and examples of network architecture, topology and design diagrams, and libraries of symbols for network components.
Use templates and examples from Computer & Networks solution to draw professional-looking network diagrams quickly and easily, and to clearly present and communicate it to IT and telecom engineers, stakeholders and end-users.
TEN RELATED HOW TO's:
Big and complex projects sometimes need some simplification of plans and schedules. That's why Program Evaluation and Review Technique was invented and first implemented in 1958. You can create PERT diagrams effortlessly with ConceptDraw DIAGRAM and share them with your colleagues.
Program Evaluation Review Technique (PERT) is a method that is used to assess and analyze projects. PERT is a valuable tool for the project management practice. PERT gives an assessment and analysis of the time needed to the project completion. A PERT chart is a visual tool that delivers a graphical view of a project timeline. It is used to display the sequences and dependences of project tasks necessary to complete a project. ConceptDraw DIAGRAM delivers the possibility to build a PERT along with other diagrams applied to assist management process by using its Seven Management and Planning Tools solution.
Picture: Program Evaluation and Review Technique (PERT) with ConceptDraw DIAGRAM
Related Solution:
Functional modeling allows to make complex business processes simple. One of the basic methods is IDEF0 and one of the most effective also. To create a business model, use flowchart symbols.
The IDEF0 library, supplied with ConceptDraw IDEF0 Diagrams solution contains 18 IDEF0 basic notation symbols. All symbols are the vector graphic images what means, that one can customize their size preserving the stable quality. Another library of IDEF0 symbols can be find out in the the Business Process Diagrams solution, included to the Business Processes section of ConceptDraw Solution Park. These libraries composed from just vector objects and are totally compatible. You can apply the IDEF0 symbols from both libraries at your flowcharts, if needed.
Picture: IDEF0 Flowchart Symbols
Related Solution:
Database design is an important part of any project, as databases become more and more complex nowadays. To make the model more representative, entity relationship diagrams are widely used in software engineering area. These diagrams show sets of entities as rectangles connected via lines labeled with their cardinalities.
This an example of the ER-diagram developed to store information regarding some online role-playing game. It includes three main elements of ER diagram: entities, relationships and attributes. The entities, attributes and relationships on this ER-diagram is depicted according to the Chen's notation. Chen's notation for Entity Relationship diagrams admits using of rectangles to depict entities, ovals for attributes and ,at least, diamonds to show relationships. ConceptDraw Entity-Relationship Diagrams solution was applied as ERD software to create this diagram.
Picture: ConceptDraw DIAGRAM ER Diagram Tool
Related Solution:
Interactive Voice Response (IVR) Balance Recharge Diagram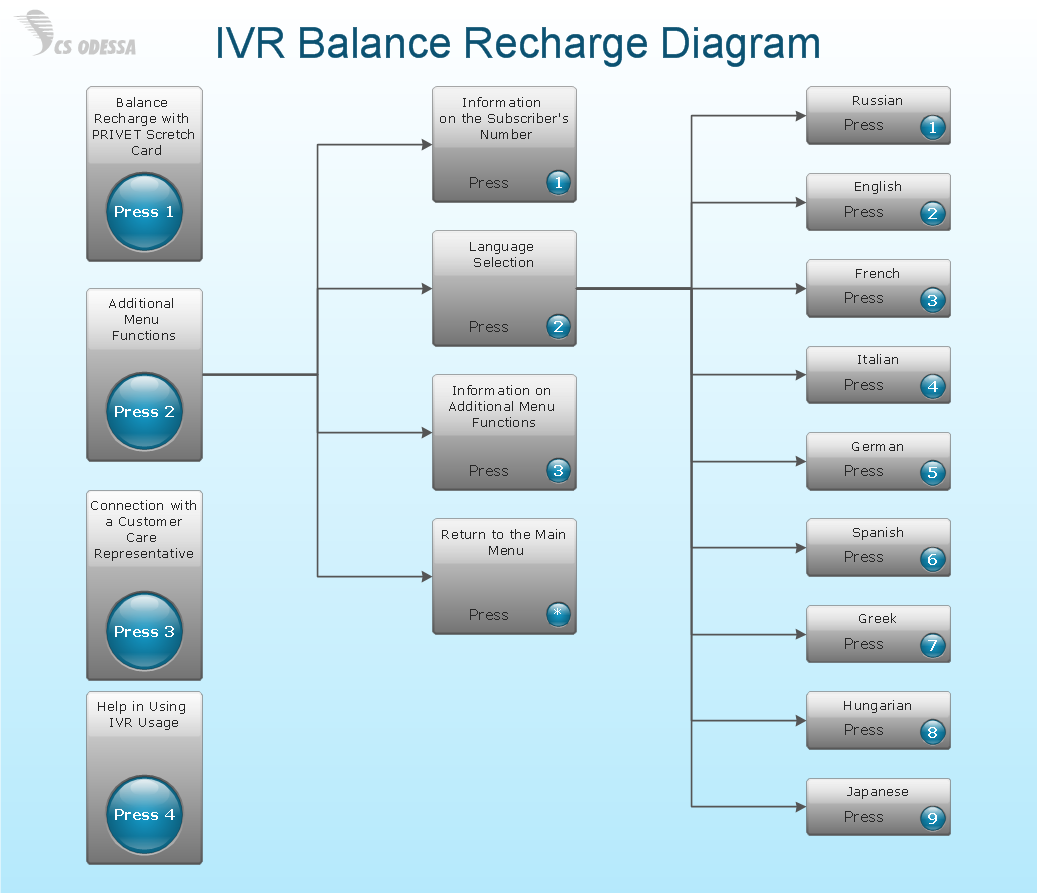
Picture: Network Diagram SoftwareIVR Balance Recharge Diagram
Do you like infographics and data visualization? Creating infographics is super-easy with ConceptDraw.
Picture: Spatial infographics Design Elements: Transport Map
If you want to find a way to understand complex things in minutes, you should try to visualize data. One of the most useful tool for this is creating a flowchart, which is a diagram representing stages of some process in sequential order. There are so many possible uses of flowcharts and you can find tons of flow charts examples and predesigned templates on the Internet. Warehouse flowchart is often used for describing workflow and business process mapping. Using your imagination, you can simplify your job or daily routine with flowcharts.
Warehouse flowcharts are used to document product and information flow between sources of supply and consumers. The flowchart provides the staged guidance on how to manage each aspect of warehousing and describes such aspects as receiving of supplies; control of quality; shipment and storage and corresponding document flow. Warehouse flowchart, being actual is a good source of information. It indicates the stepwise way to complete the warehouse and inventory management process flow. Also it can be very useful for an inventory and audit procedures.
Picture: Flow Chart Example: Warehouse Flowchart
Related Solution:
You need design the Functional Block Diagram and dream to find the useful tools to draw it easier, quickly and effectively? ConceptDraw DIAGRAM offers the Block Diagrams Solution from the Diagrams Area which will help you!
Picture: Functional Block Diagram
Related Solution:
Data Flow Diagram is used to depict the flow of data through the system, where it enters and exits the system, as well as where it is stored. To simplify the process of drawing a data flow diagram (DFD), ConceptDraw DIAGRAM provides a DFD Library - design elements that will help you make your diagram as informative, streamlined and understandable as possible. Data flow diagrams are useful to create a general overview of the system or to document major data flows.
Here are the library of symbols used in data flow diagrams (DFD). Data Flow diagrams are graphic means of business process visualization. Any business process may involve the data transfer. It can be easily shown using data flow diagrams. DFDs are used to represent the processing and transformation of data within a business process. One can find out the Vector library of DFD symbols, that is a component of ConceptDraw solution for Data Flow Diagramming and is welcome to use in as addition to the common Conceptdraw DIAGRAM diagramming facilities.
Picture: DFD Library — Design elements
Related Solution:
Create your own flow charts of computer or network system account processing using the ConceptDraw DIAGRAM.
Picture:
Account Flowchart
Flowchart ExamplesRelated Solution:
Collaboration software for small and medium business allows communicate with partners around the globe via Skype.
Picture: How to Collaborate in Business via Skype
Related Solution:
ConceptDraw
DIAGRAM 18