State Diagram Example — Online Store
State machine diagrams — describes the current state of a machine, which values are acting upon it. It shows what actions the nodes of a software system take, dependent on explicit events.
ConceptDraw is dedicated to providing system designers and specialists with the optimum tools required to create diagrams in a coherent and efficient manner, maximising possible output to keep up with the designer's speed of thought.
The Rapid UML solution consists of numerous vector stencil libraries, containing the generic icons of the Unified Modeling Language State Diagram.

Example 1. Design elements — UML State Diagram
This sample was created in ConceptDraw DIAGRAM diagramming and vector drawing software using the UML State Mashine Diagram library of the Rapid UML Solution from the Software Development area of ConceptDraw Solution Park.

Example 2. Rapid UML in ConceptDraw STORE
This sample shows the work of the online store and can be used for the understanding of the online shopping processes, for projection and creating of the online store.
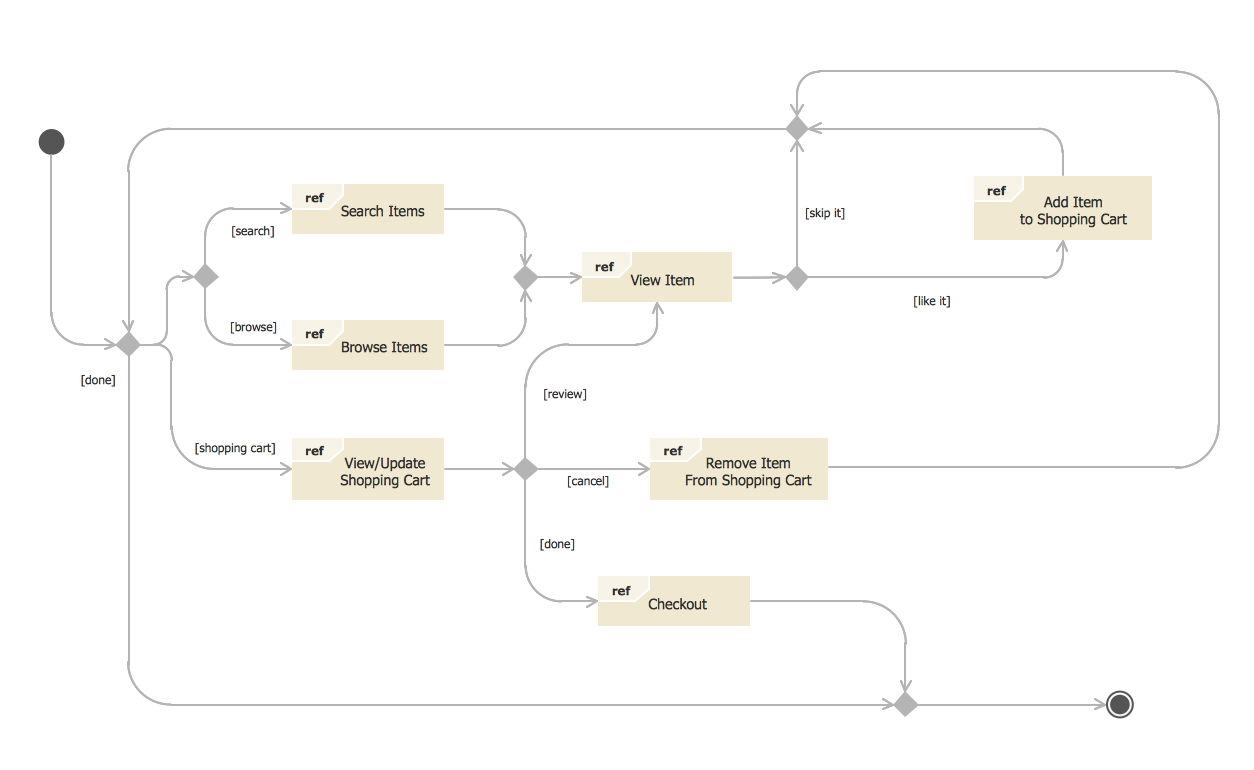
Example 3. State Diagram UML of Online Store
Using the libraries of the Rapid UML Solution for ConceptDraw DIAGRAM you can create your own visual vector UML diagrams quick and easy.
UML Resource:
NINE RELATED HOW TO's:
When trying to figure out the nature of the problems occurring within a project, there are many ways to develop such understanding. One of the most common ways to document processes for further improvement is to draw a process flowchart, which depicts the activities of the process arranged in sequential order — this is business process management. ConceptDraw DIAGRAM is business process mapping software with impressive range of productivity features for business process management and classic project management. This business process management software is helpful for many purposes from different payment processes, or manufacturing processes to chemical processes. Business process mapping flowcharts helps clarify the actual workflow of different people engaged in the same process. This samples were made with ConceptDraw DIAGRAM — business process mapping software for flowcharting and used as classic visio alternative because its briefly named "visio for mac" and for windows, this sort of software named the business process management tools.
This flowchart diagram shows a process flow of project management. The diagram that is presented here depicts the project life cycle that is basic for the most of project management methods. Breaking a project into phases allows to track it in the proper manner. Through separation on phases, the total workflow of a project is divided into some foreseeable components, thus making it easier to follow the project status. A project life cycle commonly includes: initiation, definition, design, development and implementation phases. Distinguished method to show parallel and interdependent processes, as well as project life cycle relationships. A flowchart diagram is often used as visual guide to project. For instance, it used by marketing project management software for visualizing stages of marketing activities or as project management workflow tools. Created with ConceptDraw DIAGRAM — business process mapping software which is flowcharting visio alternative or shortly its visio for mac, this sort of software platform often named the business process management tools.
Picture: Process Flowchart: A Step-by-Step Comprehensive Guide
Related Solution:
Video tutorials on ConceptDraw products. Try it today!
Picture: Presenting Documents with Remote Presentation for Skype Solution
Related Solutions:
Any work process visualized as a workflow diagram becomes easier-to-analyse. To visualize work processes regularly we recommend to use ConceptDraw DIAGRAM software extended with the Workflow Diagrams solution. This software contains features and technologies designed to draw workflow diagrams faster.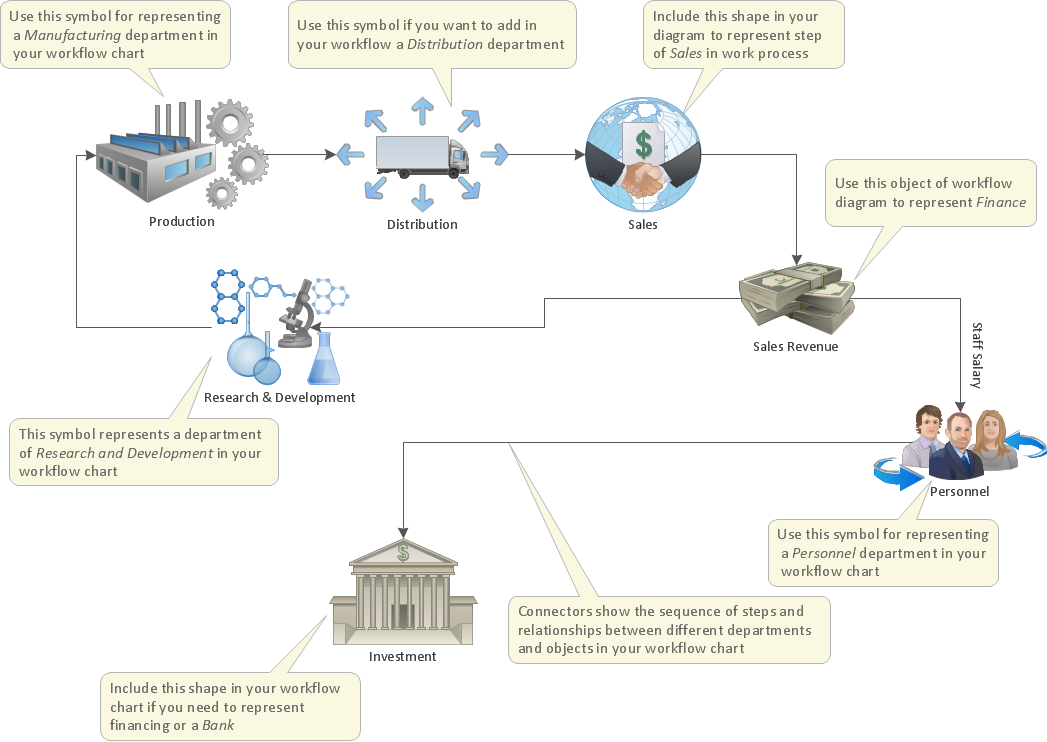
Picture: Work Process
Related Solution:
ConceptDraw DIAGRAM enhanced with Flowcharts Solution is the best flow chart maker online design software. Use it to ✔️ create clear and actionable Flowcharts, ✔️ improve decision-making, ✔️ enhance problem-solving in various scenarios, ✔️ enhance creativity and productivity across industries, ✔️ streamline workflows
Picture: Flow Chart Online
Related Solution:
Garrett IA diagrams are used at development of Internet-resources, in particulars at projecting of interactions of web-resource elements. The diagram of information architecture of the web resource which is constructed correctly with necessary details presents to developers the resource in comprehensible and visual way.
Picture: Garrett IA Diagrams with ConceptDraw DIAGRAM
This sample shows the UML Class Diagram of delivery system. On this diagram you can see the classes that are connected with aggregation and composition associations indicated with the multiplicity. This sample can be used by delivery services, postal services.
Picture: UML Diagram for System
Related Solution:
UML state machine's goal is to overcome the main limitations of traditional finite-state machines while retaining their main benefits.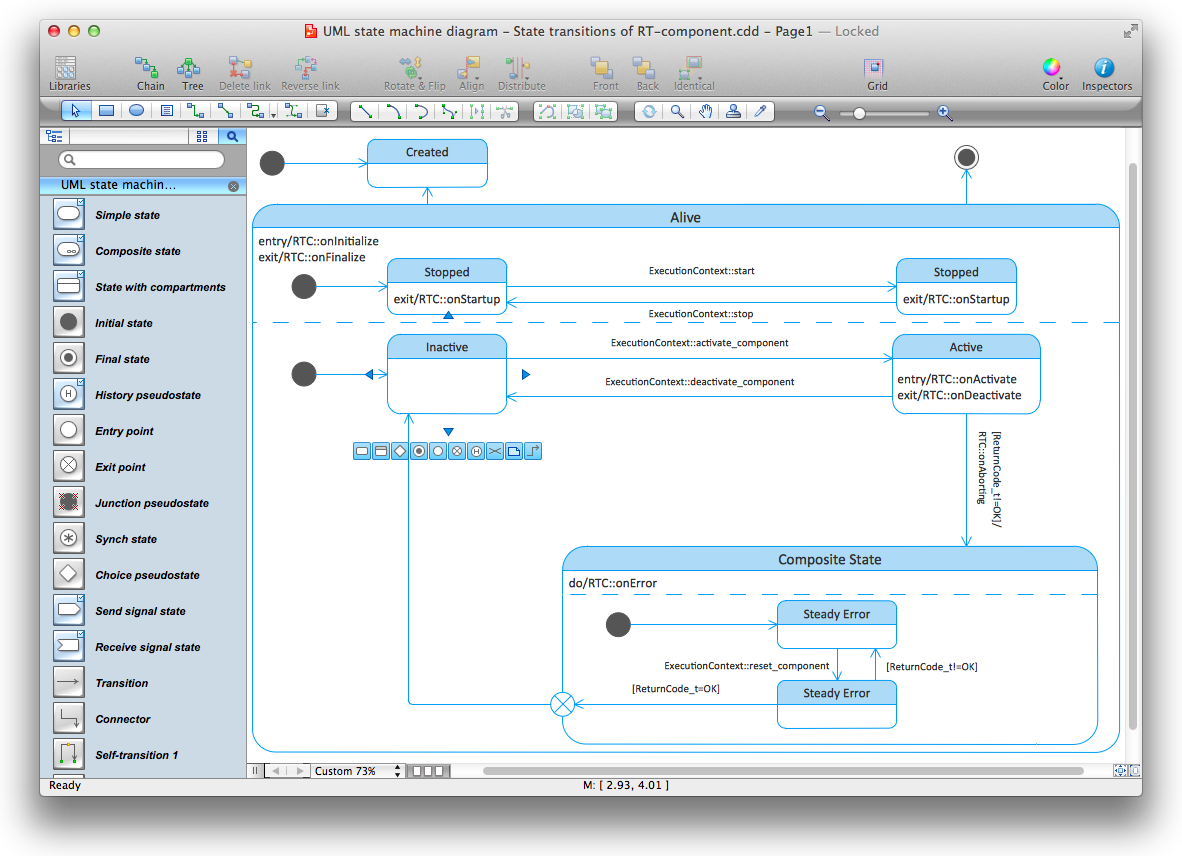
Picture: Diagramming Software for Design UML State Machine Diagrams
Value Stream Mapping solution extends ConceptDraw DIAGRAM software with templates, samples and vector shapes for drawing the current state value stream maps.
Picture: Learn how to create a current state value stream map
Related Solution:
Structure of a software product might get very complex and complicated, if software engineers did not pay much attention to the architecture of the product. It will take a few minutes to create UML diagrams with ConceptDraw DIAGRAM , because this software is just perfect for diagramming. You can alter ready-to-use templates, or make your own, whatever you need.
This illustration represent the example of UML diagram made by using ConceptDraw Rapid UML solution. This activity diagram displays the stages of the software development process similar to a flow chart. This diagram depicts the states of elements in the software system. It can be applied to represent software and coding logic. This UML diagram was drawn with the help of the ConceptDraw Rapid UML solution which supplies the kit of vector libraries, containing the symbols of the Unified Modeling Language notations.
Picture: UML Diagrams with ConceptDraw DIAGRAM
Related Solution:
