Made with
ConceptDraw
DIAGRAM 18

The Best Tool for Business Process Modeling

Event Driven Process Chain (EPC)

An event-driven process chain is well known as well as a commonly used type of flowchart, especially within the business process modelling science. They can be also used in order to configure a so called “enterprise resource planning” implementation. They can be very useful in the process of the business process improvement as well as for controlling the work share with instances of the autonomous workflows. It is a process chain used in a “workflow management” and in other fields of the business activity.

The method of the “event-driven process chain” was developed by August-Wilhelm Scheer in 1990s within the framework of so called “Architecture of Integrated Information Systems”. Nowadays different businesses use the made event-driven process chain diagrams for laying out their business process workflows, used by many companies for many different business processes, such as analyzing, redesigning the business processes themselves as well as for modelling.

The mentioned “event-driven process chain method” was the one developed within the framework of “Architecture of Integrated Information Systems” (or simply “ARIS”), as it was mentioned before, and the statement that event-driven process chains are ordered graphs was also one of those found in other so called “directed graphs”. There are no restrictions appearing for existing on the possible structure of EPCs. At the same time, the non-trivial structures involve parallelism having the so called “ill-defined execution semantics”. Thus, in this case they are known to be called as “UML activity diagrams”.

There are a few elements which are used in the usual “event-driven process chain diagram”. They can be events, which are simply are passive elements in the described before “event-driven process chains”. They are used for describing under what circumstances a function (or a process) works. They also can be used for clarifying which of them a process results in or for stating a function. At the same time, “functions are known to be the “active” elements in an event-driven process chain, being used for modelling the activities or tasks within one company, describing the transformations simply from an initial state to a resulting one.

The process owner is known to be responsible for a function, being a part of some organization unit usually represented in a way of a square with a single vertical line. “Organization units” are meant to be determining which exactly organization within one particular structure of some enterprise is the one responsible for some specific function, represented in a way of an ellipse with a single vertical line.

The material, resource objects and information in the event-driven process chain portray objects in the real world, such as business entities, objects and other, inputting data serving it as the basis for a function or outputting it produced by a function. The so called “logical relationships” between elements in the control flow in the event-driven process chain are known to be described by the “logical connectors”. They are known to be functions and events. Having these “logical connectors”, it is always possible to split the control flow from one flow to at least two or even more flows. It is usually done for synchronizing the control flow from two or over two flows to just one.

A control flow as an element of an event-driven process chain is used for connecting events with functions, logical connectors or process paths. They are used for creating the logical interdependencies as well as the chronological sequence between them. Such “control flow” element is usually represented simply as a dashed arrow, when the “information flows” show the connections between different functions and so the input (or output) data. Another element of any event-driven process chain is the “organization unit assignments”. They are used for showing the different connections between an organization unit itself and the function, which it is responsible for. One of the last, “process paths” element is commonly used as a navigation aid in the event-driven process, for showing the connection from (or to) other processes. Every process path is known to be represented in a way of a compound symbol, being composed of a function symbol. In order to employ such process path symbol in an “Event-driven Process Chain diagram”, this symbol gets connected to the process path symbol, indicating the fact that this particular process incorporates the entirety of a second process which is represented by a single symbol.

It is also important to mention the three existing kinds of logical relationships within the event-driven process chains, which are branch and merge, fork and join and an 'OR' relationship. The first one correspond to making the decision of which exactly path it is better to choose out of a few control flows. A “fork and join” one corresponds to activating all the paths in the “control flow”, when “OR” relationship corresponds to activating one or over one in the control flows. Such opening “OR” connector may have one incoming control flow as well as two or more “outgoing” control flows, so when the condition is fulfilled, the mentioned “opening OR” connector can activate one or over control flows. When there is at least one of all the incoming control flows finally activated, then the closing “OR connector” can pass the control to the next element, going after it.

The Best Tool for Business Process Modeling

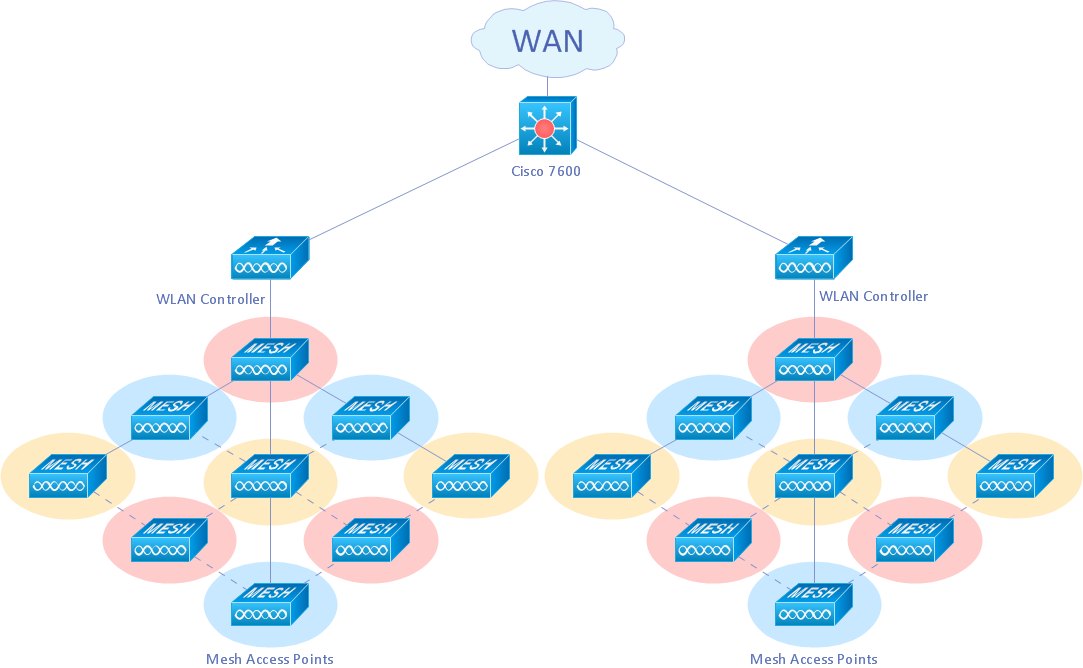
Pic.1 The Best Tool for Business Process Modeling (Mac OS X® and Windows®)

ConceptDraw DIAGRAM diagramming and vector drawing software offers you the Event-driven Process Chain Diagrams EPC solution from the Business Processes Area of ConceptDraw STORE.

The Best Tool for Business Process Modeling *

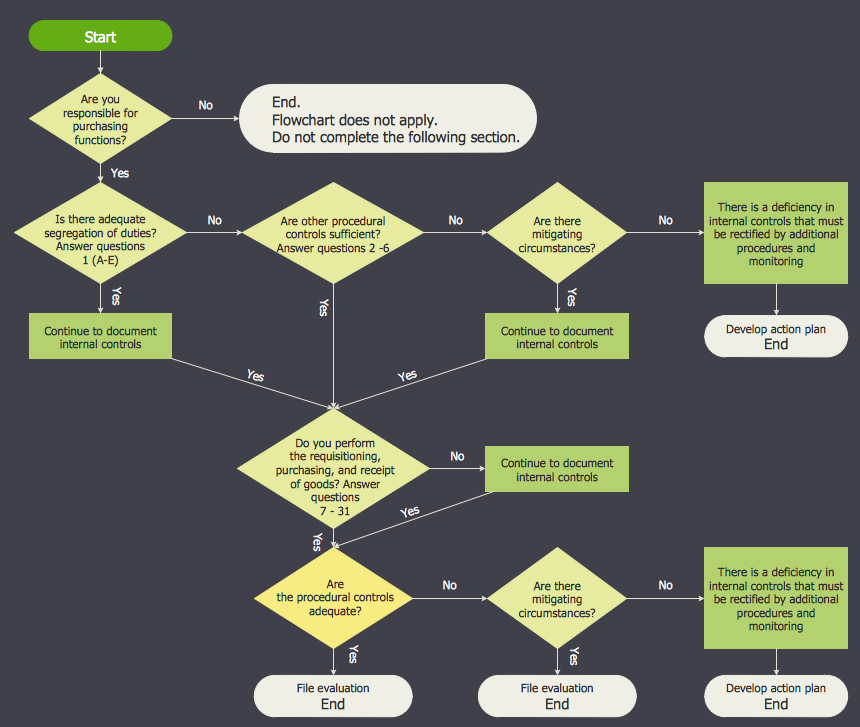
Pic.2 Event Driven Process Chain (EPC) Diagram. Login and Registration Processing Sample.

If you are among of those who want to create a great looking event-driven process chain diagram, then one of the best tools may be the application, developed especially for the purpose of making such drawings — ConceptDraw DIAGRAM diagramming and drawing software is here on this site for being downloaded and used for creating any needed schematics, such as charts, flowcharts, any diagram, including the event-driven process chain one, map, plan and so many more drawings.

EPC templates, samples, and symbols

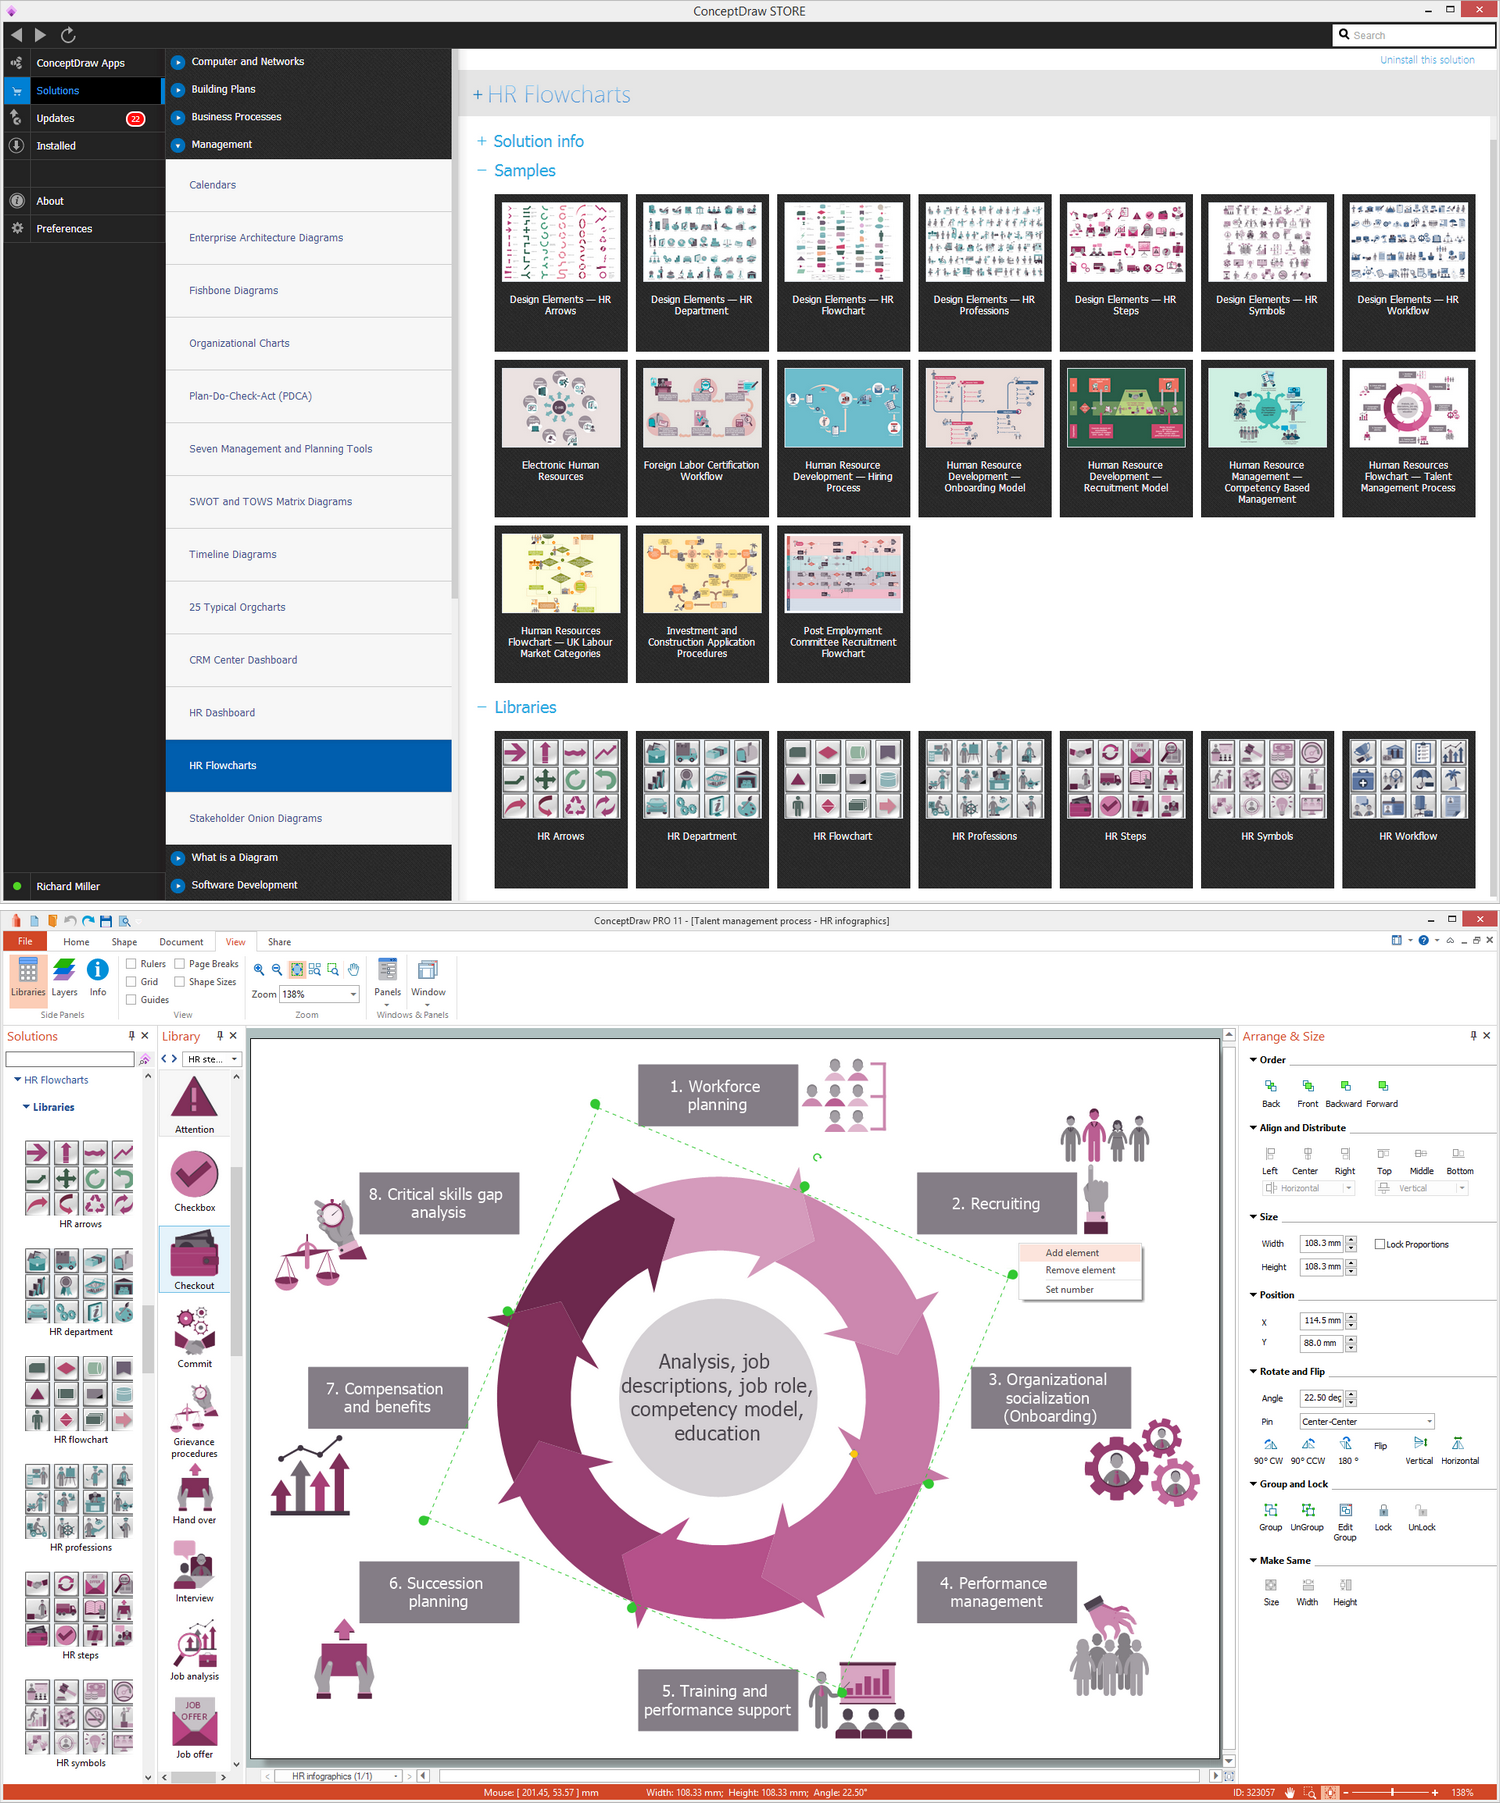
Pic.3 Event Driven Process Chain (EPC) templates, samples, and symbols

The Event-driven Chain Diagrams solution assists in the planning of resources and is excellent business process improvement tools using EPC flowcharts.


TEN RELATED HOW TO's:
ConceptDraw DIAGRAM creates drawings, flowcharts, block diagrams, bar charts, histograms, pie charts, divided bar diagrams, line graphs, area charts, scatter plots, circular arrows diagrams, Venn diagrams, bubble diagrams with great visual appeal on Mac OS X.Best Diagramming Software for macOS *
Picture: Best Diagramming Software for macOS
Related Solution:
You can use many tools to create a representation of a system behavior or a scheme of objects relationships. Some of them are quite abstract and useless, and some, like UML tools help clarifying both the structure and the behavior of a system. There are various types of uml diagrams and tons of examples explaining the difference between them. UML 2.2 specification has many kinds of diagrams. They are divided into two groups( structure and behavior diagrams). This class diagram shows the hierarchical structure of UML 2.2 specification. Class diagram - the most suitable tool for this task because it is designed to describe basic structure of a system. This diagram can be use as a visual aid for learning UML.UML Tool & UML Diagram Examples *
Picture: UML Tool & UML Diagram Examples
Related Solution:
ConceptDraw gives the ability to draw Flowchart documents. Flowcharts solutionis a powerful tool that extends ConceptDraw application for drawing business flowcharts. ConceptDraw DIAGRAM vector diagramming and business graphics software enhanced with with templates, green and interactive flowchart makers, samples and stencil libraries from ConceptDraw Solution Park which all focused to help with drawing flowcharts, block diagrams, bar charts, histograms, pie charts, divided bar diagrams, line graphs, area charts, scatter plots, circular arrows diagrams, Venn diagrams, bubble diagrams, concept maps, and others.The Best Flowchart Software Available *
Picture: The Best Flowchart Software Available
Related Solution:
ConceptDraw RapidDraw technology is a simple point-and-click design that helps create professional, presentation-ready business process diagrams quickly and efficiently.Business Process Management
Picture: Business Process Management
Any business process consists from a number of tasks carrying out the certain business goal. It is useful to diagram business processes to ensure that they are as foolproof, logical and sequential as possible. This business process diagram describes a typical booking process flow by the example of a cab booking process. It can be used as a roadmap for any booking system implementation. Diagramming a business process allows you to look at the entire project and take into account all types of possible scenarios. Business process diagram helps you investigate and clarify the process thoroughly so that you can find out how it can be improved. Business process diagram supports team communications by ensuring that each process element is clear and everyone in the team is on the same page. Sometimes your company brings you less profit than you expect it to be, and it’s difficult to reveal the causes. Maybe it’s time to learn new technologies, because business diagram are easily developed by means of special software, so you won’t make any extra effort. In return, you will increase your productivity and get more done in a less time.Business Diagram Software *
Picture: Business Diagram Software
Related Solutions:
An abstract representation is usually the first thing you will need while developing a database. To understand the ways that databases are structured, you should look through entity-relationship diagram examples and see the notations features and attributes. With an entity-relationship model you can describe a database of any complexity. This Entity-relationship diagram is a tool for software developers. It enables every element of database to be managed, communicated and tested before release. This ERD was created using symbols advocated by Chen's notation. Because of a linguistic origin of the Chen’s notation, the boxes representing entities could be interpreted as nouns, and the relationships between them are in verb form, shown on a diagram as a diamond.Entity Relationship Diagram Examples
Picture: Entity Relationship Diagram Examples
Related Solution:
Event-Driven Process chain Diagrams for improvement throughout an organisation. Best software for Process Flow Diagram. The Event-driven Process Chain (EPC) Diagrams allows managers to plan processes and resources.Business process Flow Chart — <br>Event-Driven Process chain (EPC) diagrams *
Picture: Business process Flow Chart — Event-Driven Process chain (EPC) diagrams
Related Solution:
The UML Diagrams are widely used by software developers and software engineers. They can draw the UML Diagrams manually on the paper, but it is incredibly convenient to use the special UML diagramming software. The UML diagramming software allows you to draw the UML Diagrams in a few minutes.UML Diagramming Software *
Picture: UML Diagramming Software
Related Solution:
Working with personnel might be difficult if you are not prepared enough. To explain your workers all the details of communication with customers, you can draw an order process flowchart which will describe every step of the process and answer all the questions that might appear. You can view a lot of business process mapping diagram examples here, in ConceptDraw Solution Park. This business process flow chart is created to illustrate the sample work order process. Before an organization can make some work for a person, the customer work order request must be completed. It is needed for tracking and accountability objectives. We used this business process flowchart to show a certain tasks and actions assumed by an organization. This flowchart depicts the outside inputs that are needed to launch a process, and ways the organization delivers its outputs. This business process flowchart was created with a help of ConceptDraw Business Process Mapping solution.Work Order Process Flowchart. <br>Business Process Mapping Examples *
Picture: Work Order Process Flowchart. Business Process Mapping Examples
Related Solution:
Event-Driven Process Chain Diagrams for improvement throughout an organisation. ConceptDraw DIAGRAM - business process mapping software that reduces the time needed to create a business process model.Process Modelling using Event-driven Process chain *
Picture: Process Modelling using Event-driven Process chain
Related Solution:
ConceptDraw
DIAGRAM 18