
Sample 1. Employer objectives - Bubble diagram.
ConceptDraw DIAGRAM ector diagramming and business graphics software enhanced with with templates, samples and stencil libraries from ConceptDraw Solution Park helps you to easily draw flowcharts, block diagrams, bar charts, histograms, pie charts, divided bar diagrams, line graphs, area charts, scatter plots, circular arrows diagrams, Venn diagrams, bubble diagrams, concept maps, and others.
Use ConceptDraw DIAGRAM with Solution Park to draw you own diagrams, charts and graphs for graphic communication, explanation of business and personal ideas and concepts, simple visual presentation of numerical data, complex structures, logical relations, step-by-step flows of actions, operations or math algorithm.
NINE RELATED HOW TO's:
Is it possible to draw a diagram as quickly as the ideas come to you? The innovative ConceptDraw Arrows10 Technology included in ConceptDraw DIAGRAM is a simple and powerful tool to create any type of diagram.
You mau choose to start from one of plenty diagram templates or to use your own idea.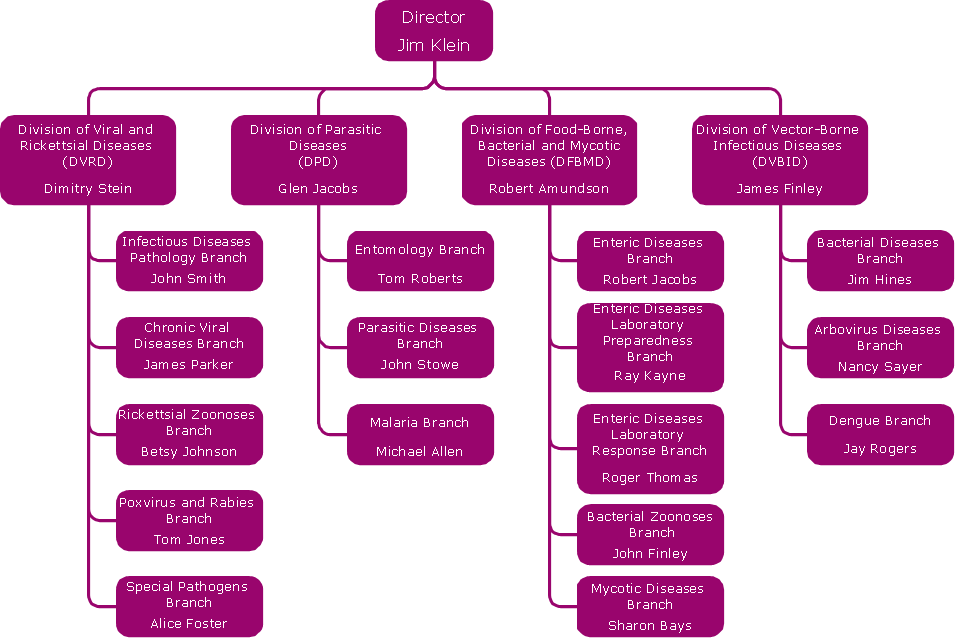
Picture: How To Draw a Diagram
A pie chart or a circle graph is a circular chart divided into sectors, illustrating numerical proportion. In a pie chart, the arc length of each sector and consequently its central angle and area, is proportional to the quantity it represents.
Pie chart examples and templates created using ConceptDraw DIAGRAM software helps you get closer with pie charts and find pie chart examples suite your needs.
Picture: Pie Chart Examples and Templates
Related Solution:
Try ConceptDraw program, the perfect drawing tool for creating all kinds of great-looking drawings, charts, graphs, and illustrations.
Picture: Basic Diagramming
Related Solution:
A Wireless network is a type of the computer network that uses the wireless connections for connecting network nodes for data transfer. The wireless networks are very useful, inexpensive, popular and widely used. They are easy setup and do not require the cables installation.
Using the solutions of the Computer and Networks Area for ConceptDraw DIAGRAM you can design the wireless network diagrams of any complexity quick and easy.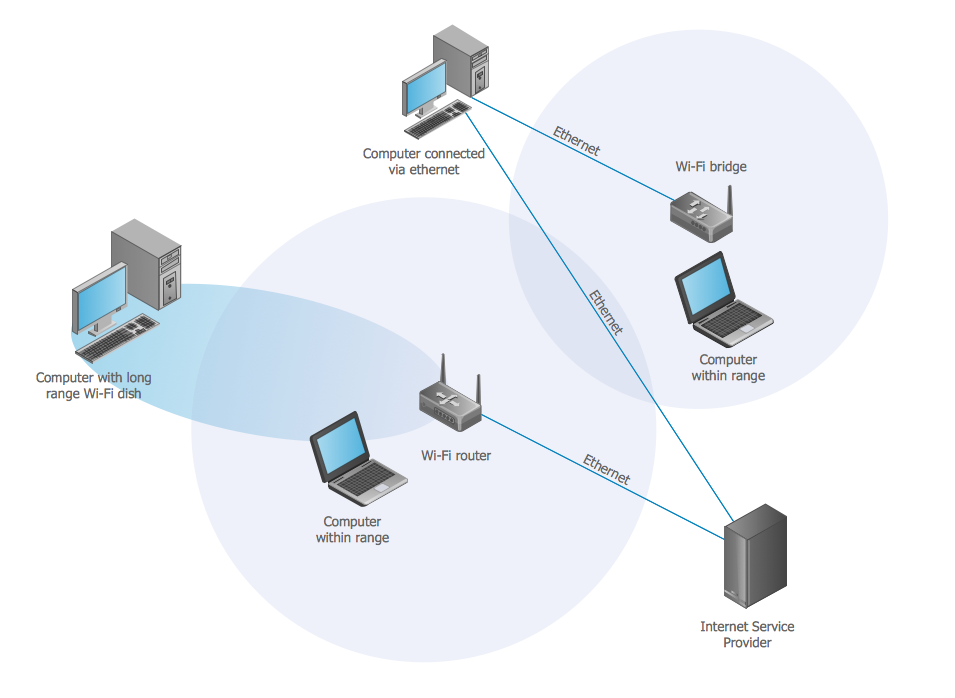
Picture: Wireless network. Computer and Network Examples
Related Solution:
In electronics, a diode is a two-terminal electronic component that conducts primarily in one direction (asymmetric conductance); it has low (ideally zero) resistance to the flow of current in one direction, and high (ideally infinite) resistance in the other. A semiconductor diode is a crystalline piece of semiconductor material with a p–n junction connected to two electrical terminals. Today, most diodes are made of silicon, but other semiconductors such as selenium or germanium are sometimes used.
26 libraries of the Electrical Engineering Solution of ConceptDraw DIAGRAM make your electrical diagramming simple, efficient, and effective. You can simply and quickly drop the ready-to-use objects from libraries into your document to create the electrical diagram.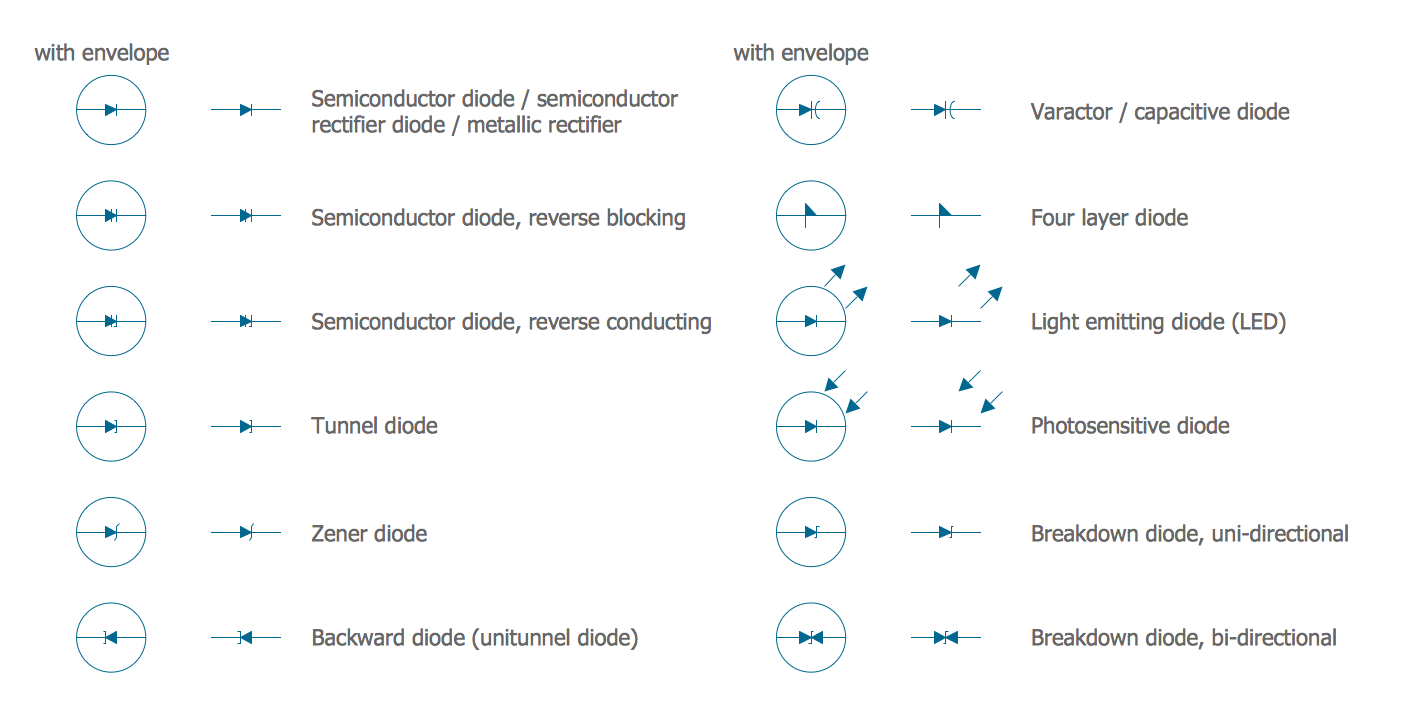
Picture: Electrical Symbols — Semiconductor Diodes
Related Solution:
The best bar chart software ever is ConceptDraw. ConceptDraw bar chart software provides an interactive bar charting tool and complete set of predesigned bar chart objects.
Picture: Bar Chart Software
Related Solution:
Database model is a graphic representation need at the beginning of project development. You won't have any problems with drawing ER diagrams on a Mac anymore with ConceptDraw DIAGRAM application. Special libraries that contain all the symbols of both Chen's and Crow’s foot notation allow you to start database modeling within a few minutes.
Creating entity-relationship diagrams on Mac is fun and effortless when you use a software designed for professional ERD drawing tailored to specific characteristics of Apple OS X. ConceptDraw DIAGRAM is a business diagramming software for those using OS X.
The Entity-Relationship Diagrams solution for ConceptDraw has 2 libraries containing about 50 vector icons, depicting ERD symbols of the most popular Chen's and Crow’s Foot Notations. The other valuable component of the solution is a collection of ERDs samples and templates that can be opened on Macs and PCs.
Picture: Drawing ER diagrams on a Mac
Related Solution:
ConceptDraw offers you a number of ready-made organizational chart templates which you can use in your drawing. They are grouped in topical sets as organizational chart template files.
Use the Organizational Charts Solution for ConceptDraw DIAGRAM to create your own Organizational Charts of any complexity quick, easy and effective.
The Organizational Charts designed with ConceptDraw DIAGRAM are vector graphic documents and are available for reviewing, modifying, converting to a variety of formats (image, HTML, PDF file, MS PowerPoint Presentation, Adobe Flash or MS Visio XML), printing and send via e-mail in one moment.
Picture: Organizational Chart Templates
Related Solution:
UML Component for Bank - This sample was created in ConceptDraw DIAGRAM diagramming and vector drawing software using the UML Component Diagram library of the Rapid UML Solution from the Software Development area of ConceptDraw Solution Park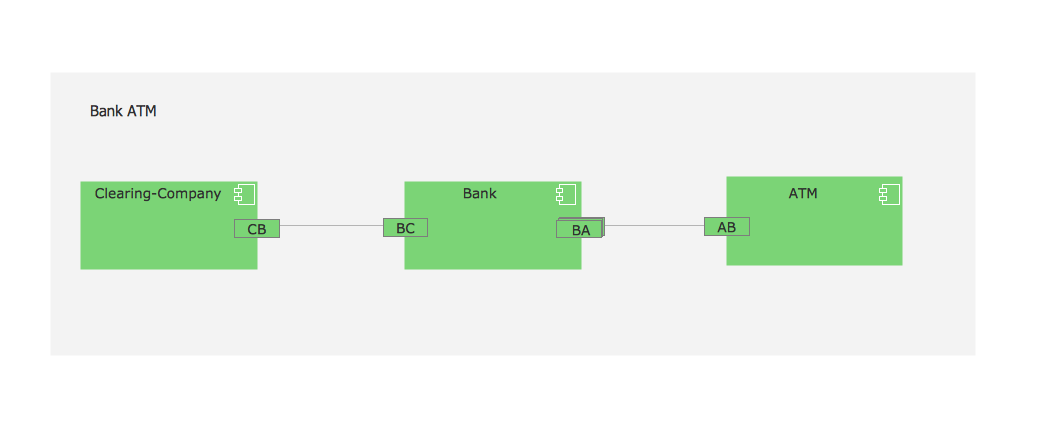
Picture: UML Component for Bank
Related Solution: