
Example 2. Table Seating Chart Template
This table seating chart template was created in ConceptDraw DIAGRAM using the Seating Plans Solution from the Building Plans area and is available from ConceptDraw STORE. An experienced user spent 5 minutes creating this sample.
All source documents are vector graphic documents. They are available for reviewing, modifying, or converting to a variety of formats (PDF file, MS PowerPoint, MS Visio, and many other graphic formats) from the ConceptDraw STORE. The Seating Plans Solution is available for all ConceptDraw DIAGRAM or later users.
Read more about Home and Landscape design
EIGHT RELATED HOW TO's:
Any hierarchical structure of any company can be represented as a triangle or a pyramid. You can create a pyramid diagram and pyramid chart of any complexity using special libraries included in ConceptDraw DIAGRAM. Actually, any knowledge or chain of facts can also be depicted as a pyramid.
A wide range of graph and chart are utilized in marketing to maintain documentation and various visual issues, that deal with marketing information and data. The marketing value pyramid can be created to illustrate how the value of company, or product is based on its competitiveness. To design this diagram we used ConceptDraw DIAGRAM drawing tools in conjunction with Pyramid solution for Solution Park.
Picture: Pyramid Diagram and Pyramid Chart
Related Solutions:
Experience the main advantage of using ConceptDraw Ice Hockey solution with all tools you need to 🔸 create professional ice hockey diagrams as quickly as possible and visualize ✔️ ice hockey rinks, ✔️ roles, ✔️ positioning, ✔️ game situations, ✔️ tactics, and ✔️ strategies to succeed in tactical planning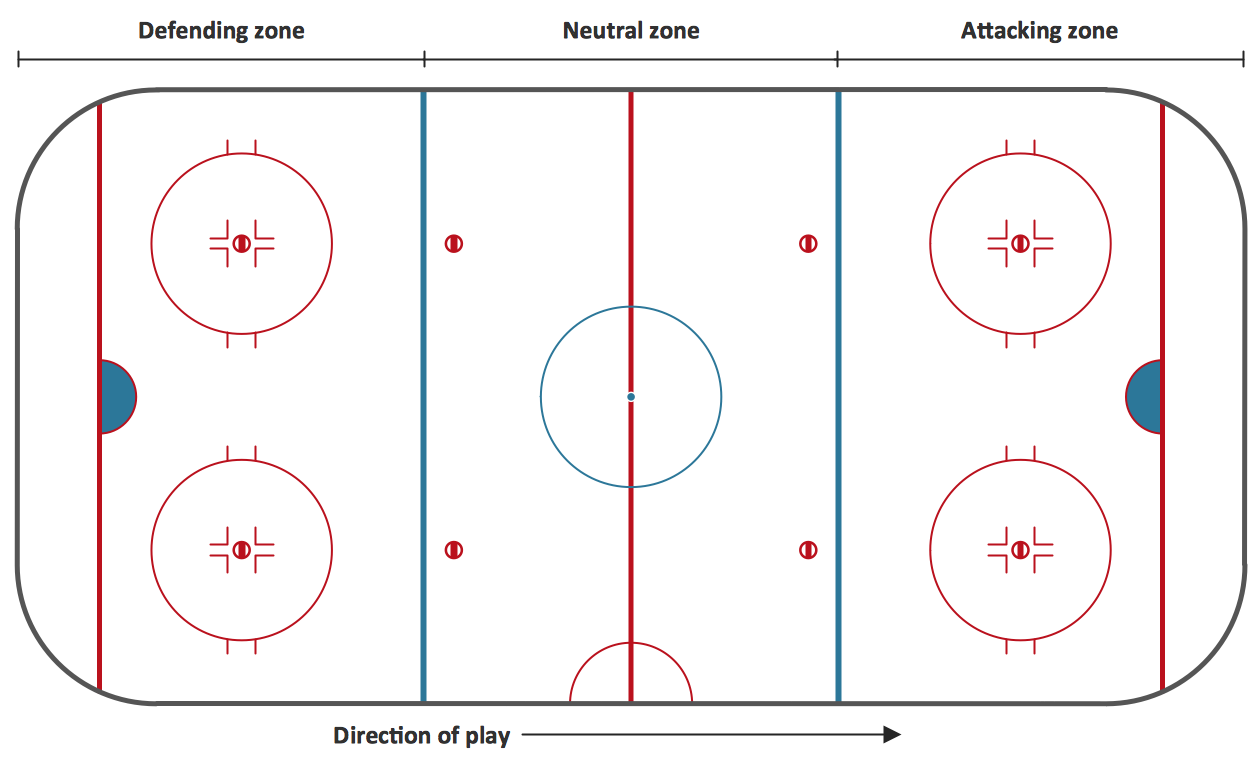
Picture: Ice Hockey Rink Diagram
Related Solution:
The use of the special software with Plant Design Solutions is a real help for effective creating the Plant Plan, Plant Layout Plan, Process Plant Layout, Plant Design. ConceptDraw DIAGRAM is the best diagramming and vector drawing software. It offers the Plant Layout Plans Solution from the Building Plans Area for achievement this goal.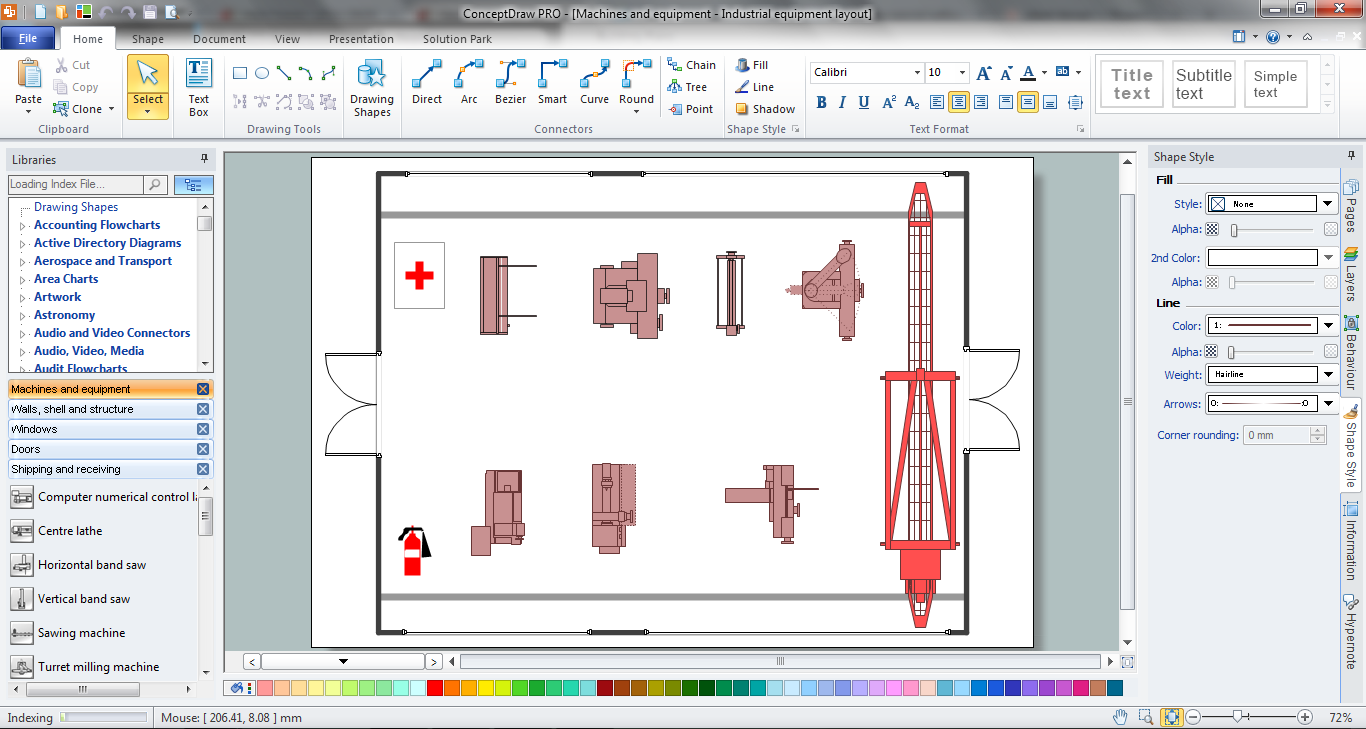
Picture: Plant Design Solutions
Related Solution:
Once you have created your document in ConceptDraw DIAGRAM and you want to share it with your colleagues and friends, who uses MS Visio on their computers, you can easily export your document using ConceptDraw DIAGRAM export to Visio XML files (VDX) feature.
Now you can share your ConceptDraw documents with MS Visio users.
Picture: Export from ConceptDraw DIAGRAM Document to MS Visio® XML
ConceptDraw DIAGRAM diagramming and vector drawing software extended with Rack Diagrams solution from the Computer and Networks area is a powerful rack diagrams and server rack diagrams drawing software.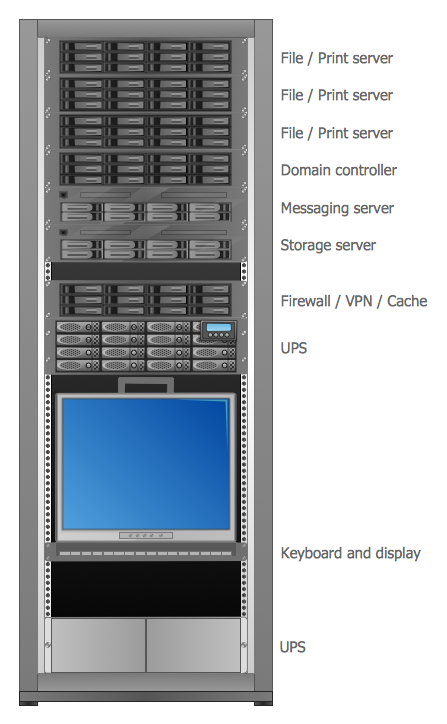
Picture: Server
Related Solution:
ConceptDraw is rapid and powerful network diagram drawing software with rich examples, templates, design objects and stencils.
Picture: Draw Network Diagram based on Templates and Examples
Why do you need network visualizations? 🔸 Unlock the full potential of network visualization with our in-depth guide on using the ConceptDraw Network Visualization Tool. ✔️ Explore features, tips, and best practices to create stunning visual representations of your network architecture
Picture:
Network Visualization Guide.
How to Use ConceptDraw Network Visualization Tool
Related Solutions:
The Audio & Video Connectors solution contains a set of pre-designed objects, libraries, templates, and samples; allowing quick and easy diagramming of various configurations of audio and video devices.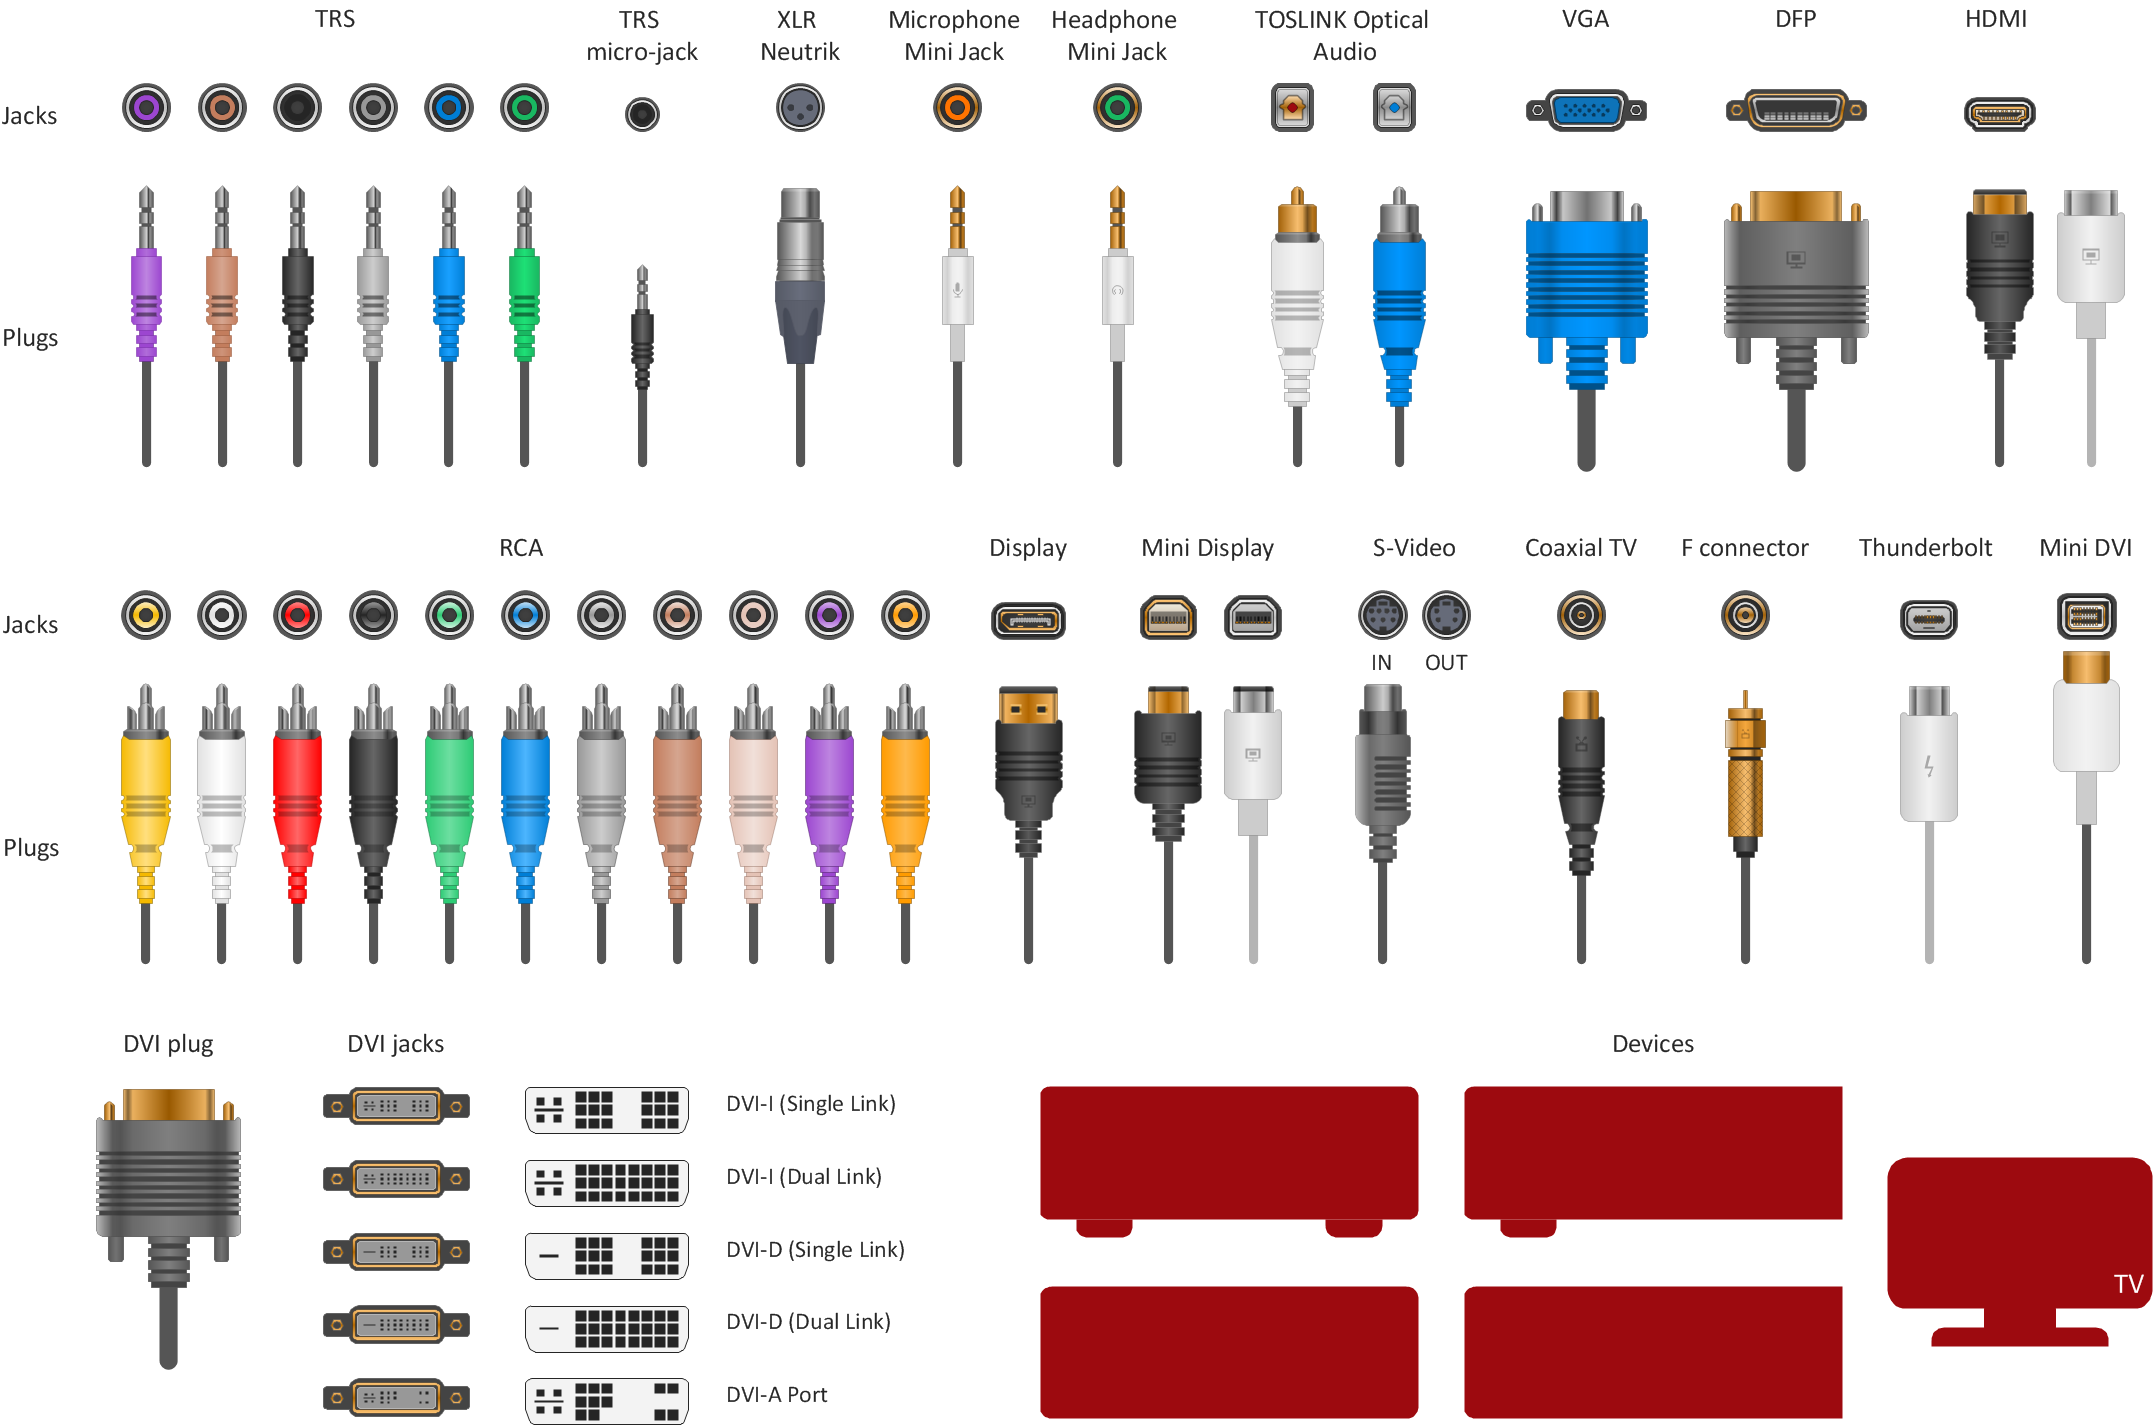
Picture: How To Print Audio & Video Connectors Schema in a Large Format
Related Solution:
