Functional Flow Block Diagram
“Flow diagram” is the one which represents some flow or dynamic relations within some system. This “flow diagram” can be also called a “flowchart” as they are used for structuring and ordering some complex system as well as revealing the underlying structure of the elements and their interaction.
There are many types of the flow diagrams, such as “alluvial diagram”, “circular flow of income”, “data flow diagram”, “control flow diagram”, “cumulative flow diagram”, “dynamic stock and flow diagram”, “information flow diagram”, “process flow diagram”, “product flow diagram”, “Sankey diagram”, “state” one, “signal-flow graph” as well as “Functional Flow Block Diagram”.
“Functional Flow Block Diagram”, or “FFBD”, is a time-sequenced and “step-by-step” flow diagram, with the help of which it is convenient to describe some system’s functional flow.
The “Functional Flow Block Diagram notation” was developed in the 50s, and it is quite widely used in classical systems engineering. “Functional Flow Block Diagrams” are the ones, used in the classic business process while modelling different methodologies, as well as flow charts, control flow diagrams, so-called “PERT” diagrams, “IDEF”, “Gantt” charts and flow charts. “Functional Flow Block Diagrams” can be also known as “Functional Flows”, “Functional Flow Diagrams” or “Functional Block Diagrams”.
“Functional Flow Block Diagrams” are usually made using a number of different levels. With their aid it is simpler to show the same tasks, which are identified through functional decomposition and so to display these tasks in their logical and sequential relations. These diagrams can be used for developing the requirements and for identifying the profitable trade studies. This kind of diagram helps incorporate the alternate as well as contingency operations and, as a result, to improve the probability of the particular mission success.
Using the flow diagrams, it is simpler to provide an understanding of some operation of the system in general. These diagrams can be used as a basis for development of both contingency and operational procedures. The pinpoints areas can be also mentioned on the flow diagrams and with the help of them it is also possible to represent different means of satisfying some function, but it is important to take into consideration, that each of the functions which are described with the aid of “FFBD” should be separated and so represented in a way of a single box. Function numbering: Each stage should have an according number scheme and provide the data regarding function origin. These numbers establish identification and relationships that will carry through all Functional Analysis and Allocation activities and facilitate traceability from lower to top levels.
There are a few principles, which is always better to follow in terms of creating the functional flow block diagrams. First of all, each of the diagrams should contain a reference to other functional diagrams in a way of using some particular functional reference. Secondly, the lines, created within such diagrams, (those, which show the connections between different functions) should indicate a function flow, but not an intermediate activity. Also these diagrams should be laid out for the flow direction to go from the left side to the right one. There are often arrows used within such diagrams and they are there for indicating the different functional flows. A circle also can be used while making such diagram and it can be used for denoting a summing gate. “Bar G” and “G” are used for denoting such conditions as “go” and “no-go”. On such block diagram a function should be represented in a way of a rectangle which contains the function’s title as well as its unique decimal delimited number. A horizontal line can be used too and it is usually there for separating the number from the title itself.
The basic logic symbols for making any “Functional Flow Block Diagram” can be: “AND” (shows the condition when all of the succeeding or the preceding paths are required; this symbol may contain an input with a few outputs or a few inputs with a single output, but never mixed multiple inputs and outputs), “Exclusive OR” (described a condition, when only one of the multiple succeeding or preceding paths is required, but never all of them; this symbol may contain an input with a few outputs, or a few inputs with an output, but never mixed inputs and outputs) and “Inclusive OR” (describes a condition when a few or all of the multiple succeeding or preceding paths are being required).
Every “Functional Flow Block Diagram” should contain a name of the person or an organization, which created this diagram, a date, showing when this diagram was created, a unique number of the function, which is diagrammed, and also a unique function name of that function, which is being diagrammed.
There are so many other block diagrams as well as “flow” ones, apart from the Functional Flow Block Diagram and you can always make any wanted with the help of ConceptDraw DIAGRAM as this software allows you to make the needed chart, flowchart, scheme, plan, schematics, drawing, diagram, including any of the existing “flow diagrams” and “block diagrams” within only a very short period of time as the Block Diagrams solution from the "Diagrams" area for ConceptDraw Solution Park, which can be found on this site and so downloaded for using, provides the necessary tools, including the examples of Functional Flow Block Diagrams of any complexity which can be used for making your own great looking diagram in ConceptDraw DIAGRAM
Having ConceptDraw DIAGRAM software as well as the needed solutions can simplify your work with making any needed drawing as well as save your time as it is well known that “time is money”, so getting the convenient and very useful application can save both — your time and your money. Try it as well as solutions and see the difference with any other applications you ever used.
You need to draw a Functional Flow Block Diagram? You are an artist? Now it doesn't matter. With Block Diagrams solution from the "Diagrams" area for ConceptDraw Solution Park you don't need more to be an artist to design the Functional Flow Block Diagram of any complexity.

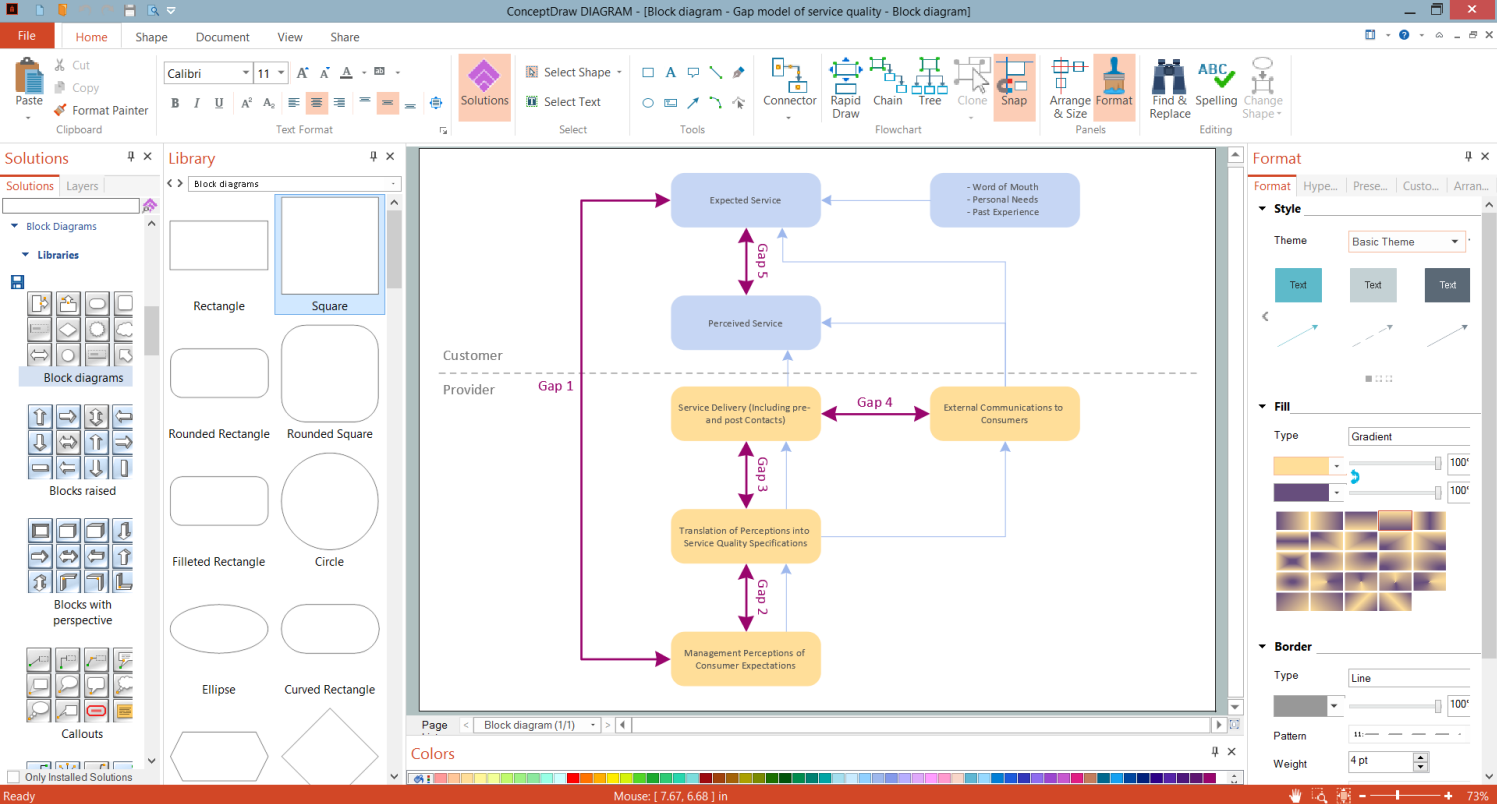
Example 1. Functional Flow Block Diagram - Total Solution Process
Block Diagrams Solution includes 5 libraries with 190 vector objects which will allow to draw any Functional Flow Block Diagram:
- Block Diagrams
- Raised Blocks
- Blocks with Perspective
- Callouts
- Connectors

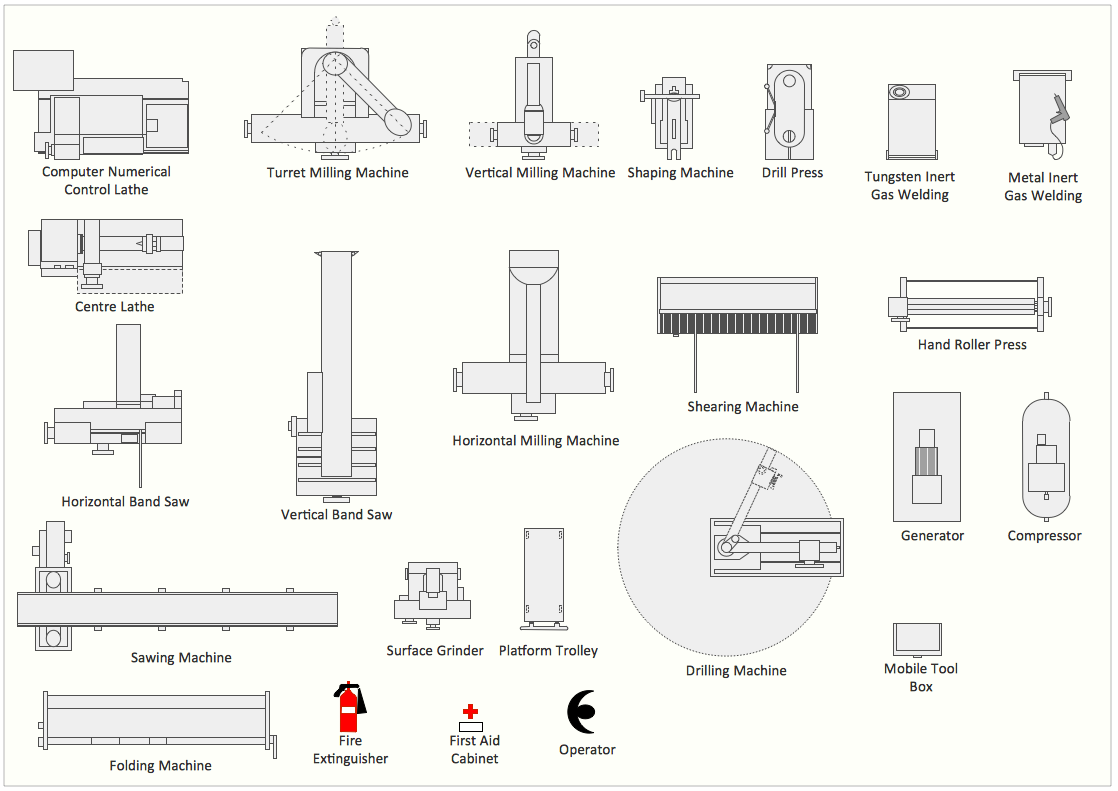
Example 2. Block Diagrams Library Design Elements
Don't forget to use the colors, to make color accents — they help to make your diagram bright, beautiful, attractive, and certainly successful on various conferences, in publications, etc.

Example 3. Functional Flow Block Diagram — Six Markets Model
The Functional Flow Block Diagrams you see on this page were created in ConceptDraw DIAGRAM using the tools of Block Diagrams Solution. They are included in Block Diagrams Solution and available from ConceptDraw STORE. An experienced user spent 5-10 minutes creating every of them.

Example 4. Block Diagrams Solution
Use the Block Diagrams Solution for ConceptDraw DIAGRAM software to create your own professional looking Functional Flow Block Diagram fast and easy, and then successfully use it in your work activity.
All source documents are vector graphic documents. They are available for reviewing, modifying, or converting to a variety of formats (PDF file, MS PowerPoint, MS Visio, and many other graphic formats) from the ConceptDraw STORE. The Block Diagrams Solution is available for all ConceptDraw DIAGRAM or later users.